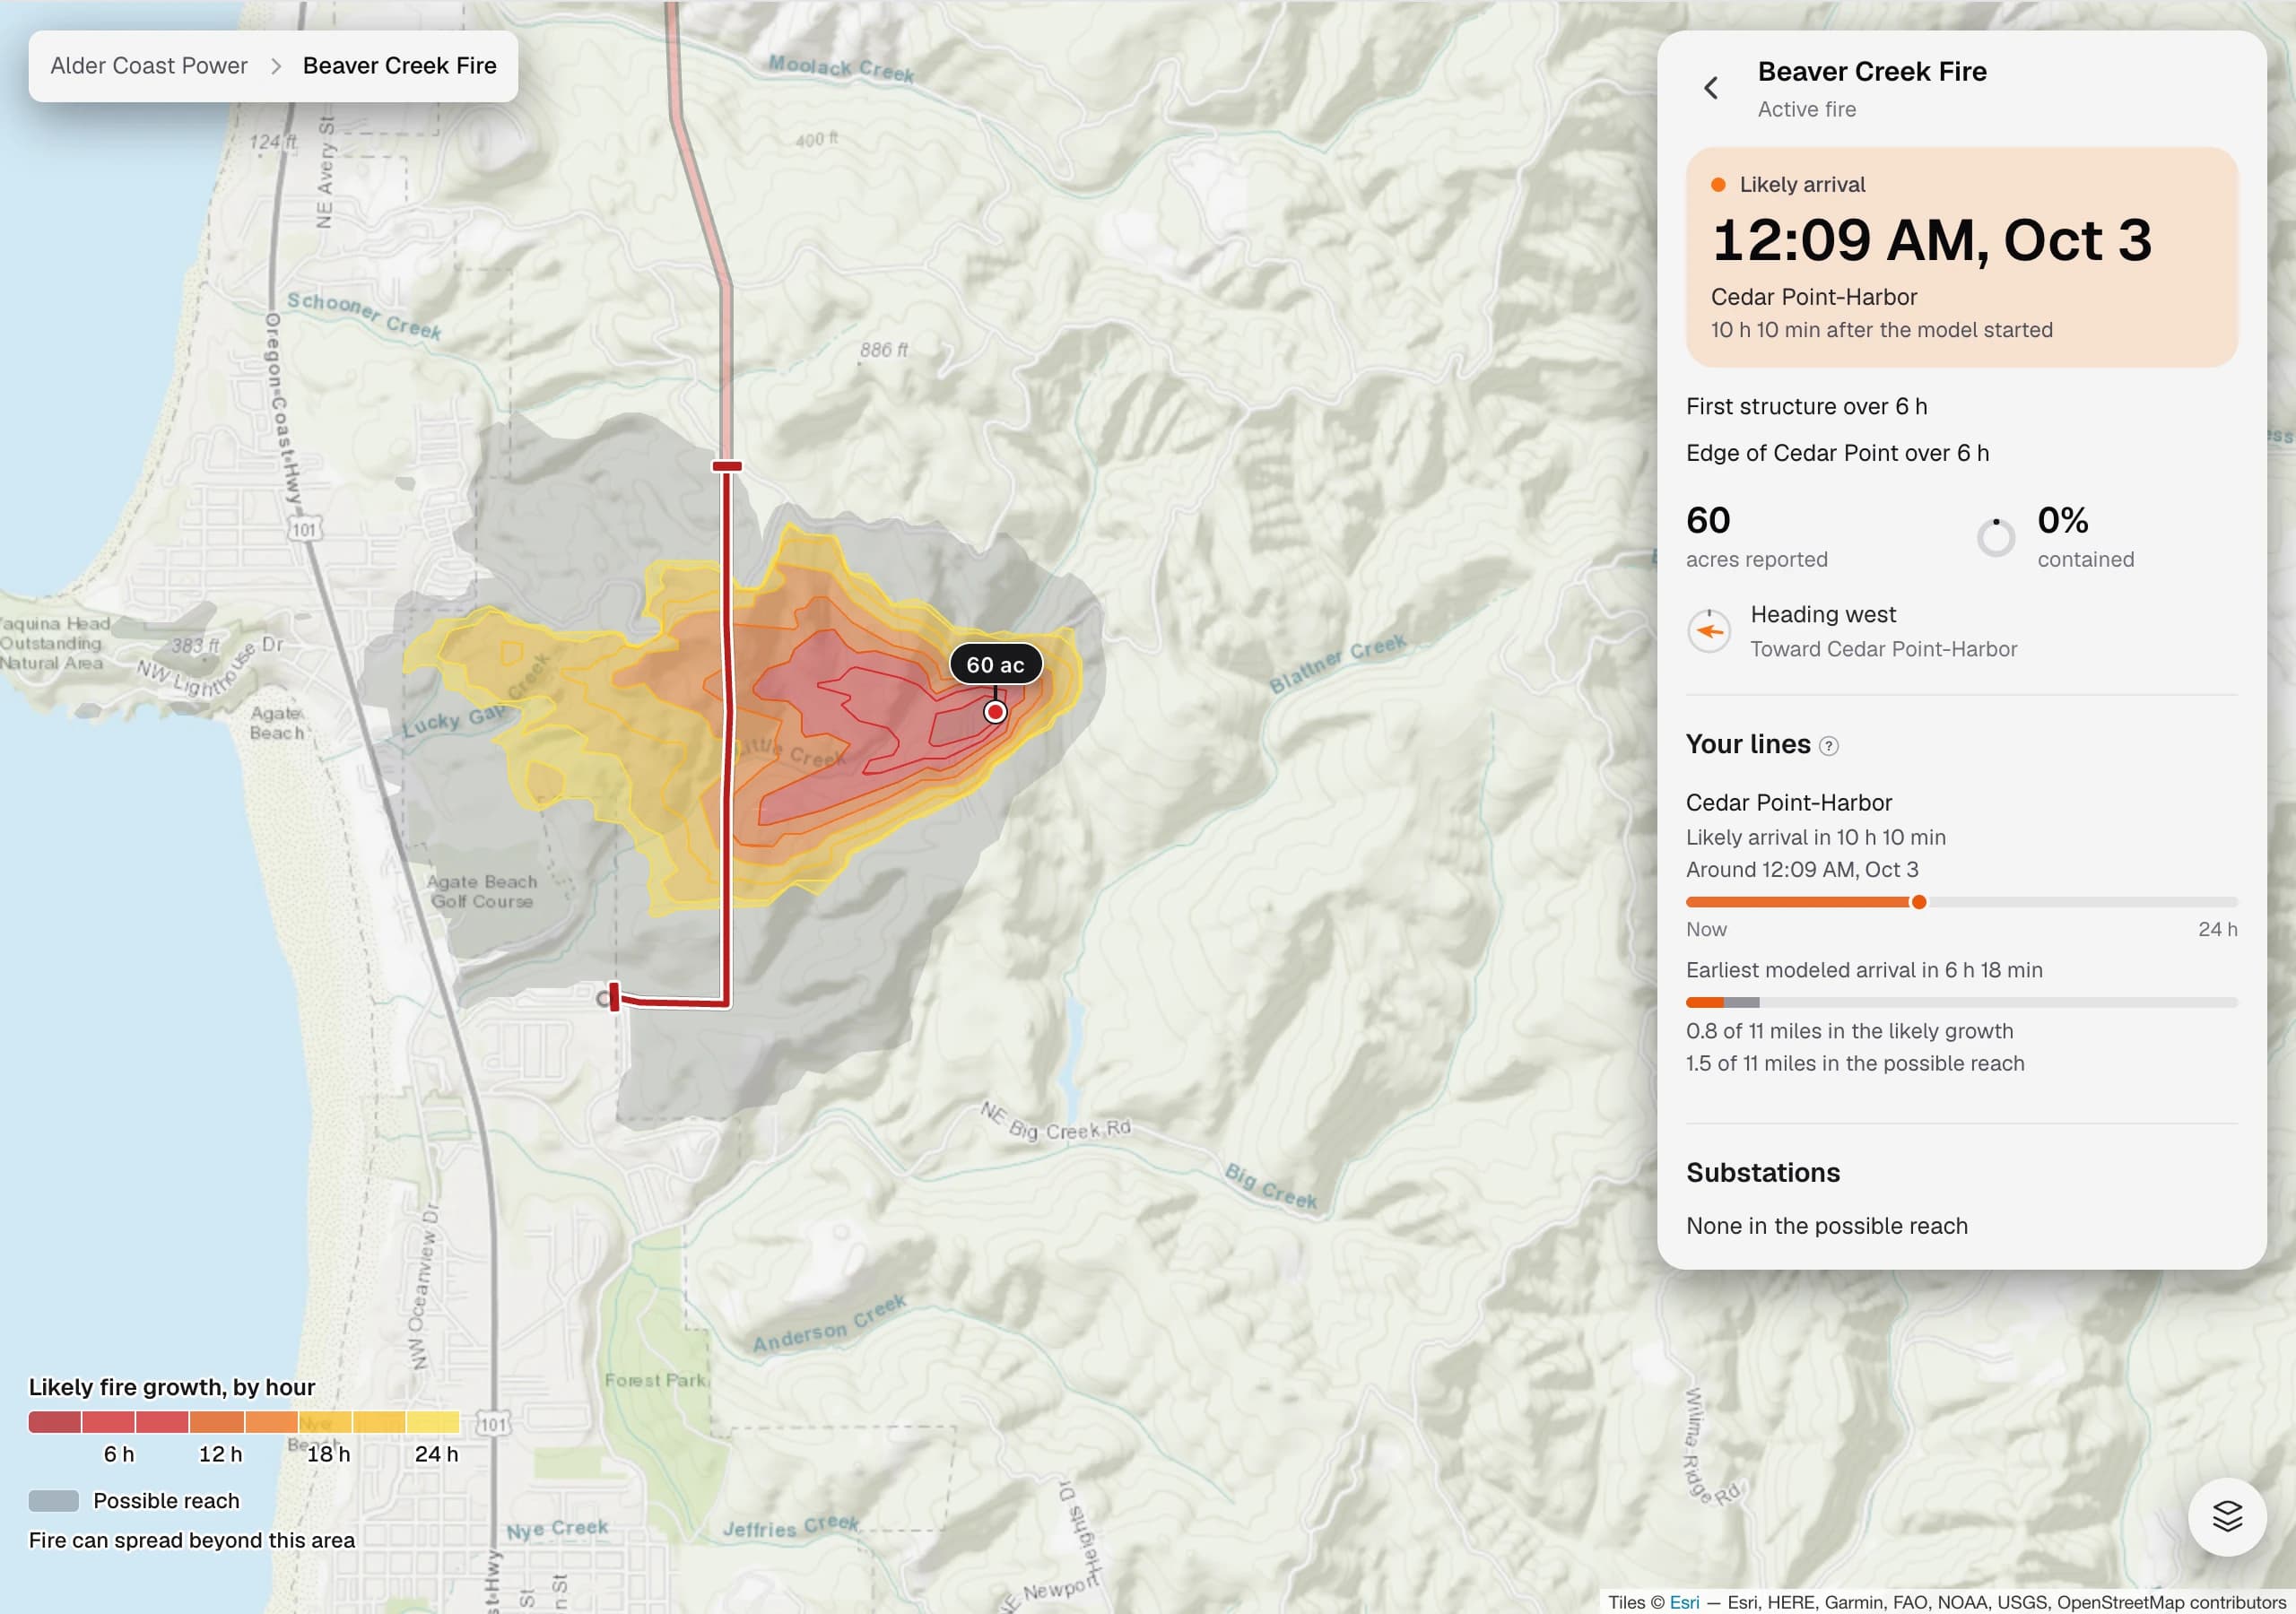
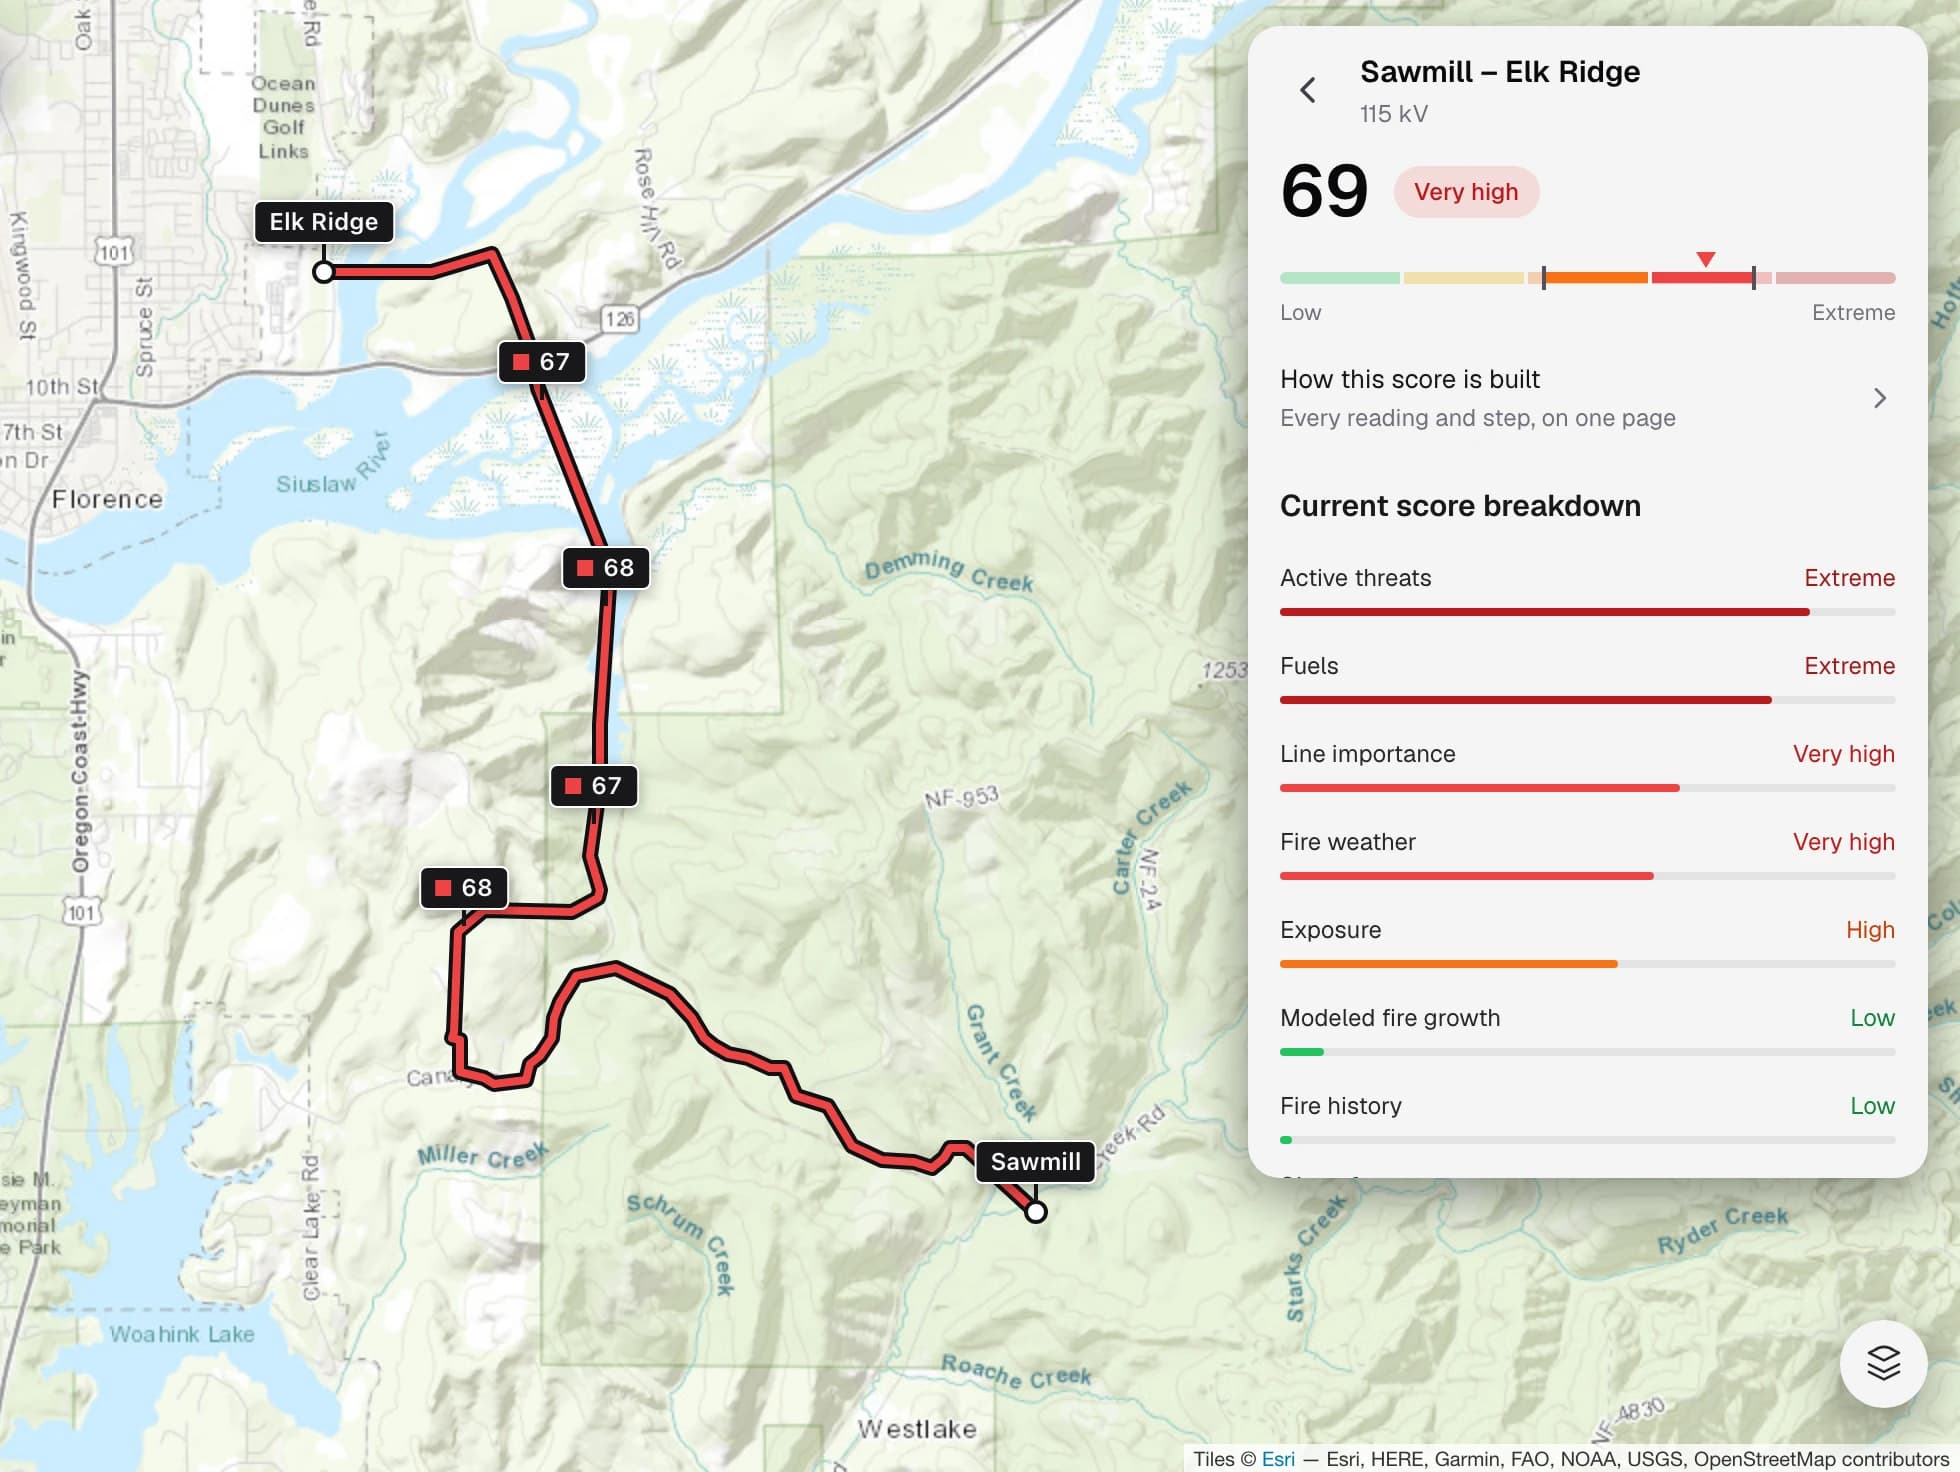
Wildfires are simulated from every point on the ignition grid and scored by the number and importance of the structures they reach. Those scores roll up into a wildfire risk score for each neighborhood.
Assess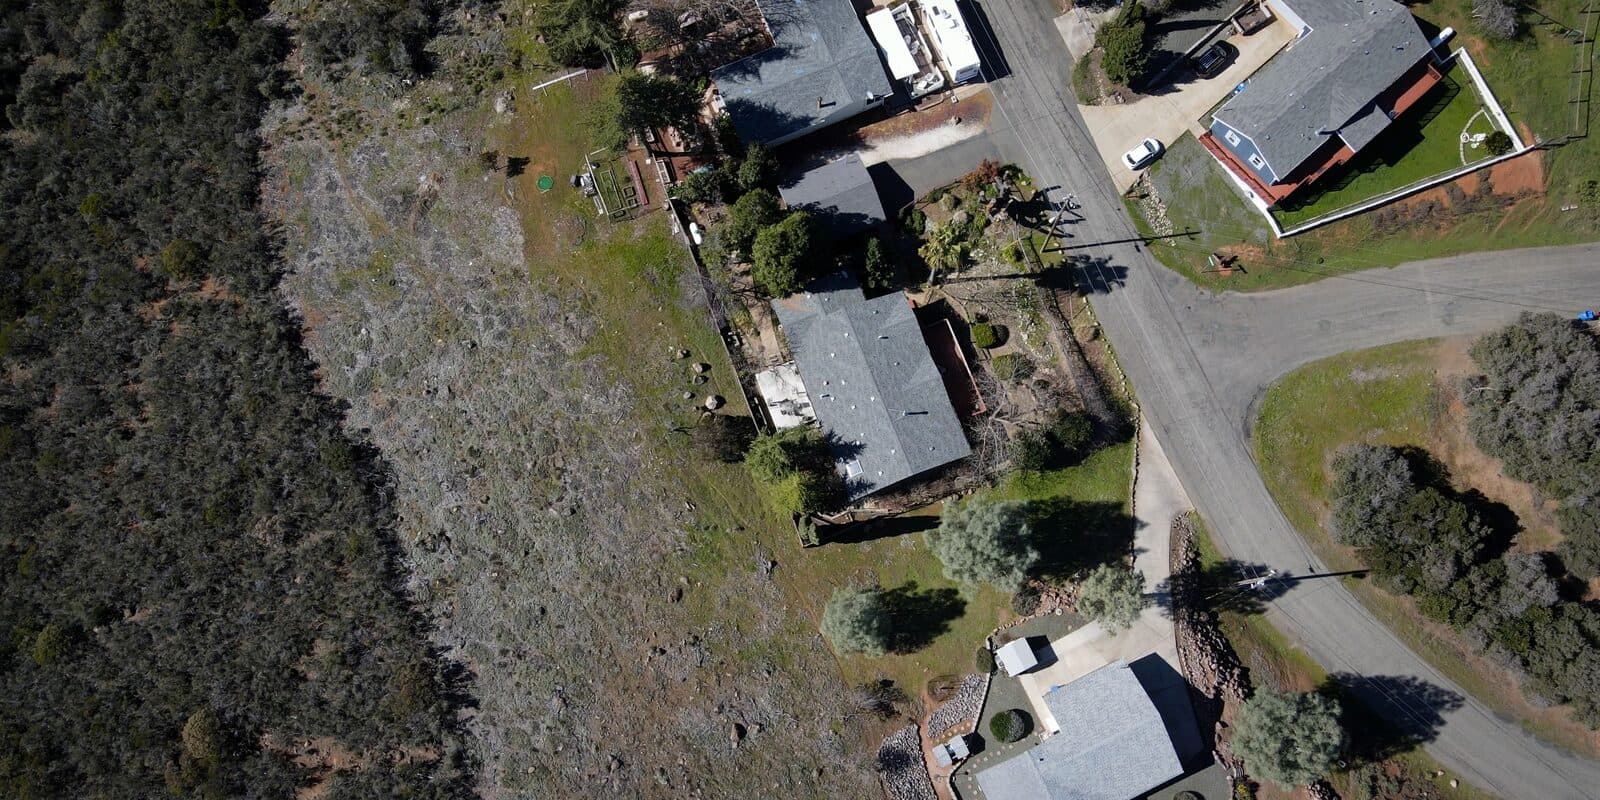
Communities
Flarecast simulates thousands of wildfire ignitions across the landscape around your community. It uses historical, current, and forecast conditions to map that risk and help keep people safe.
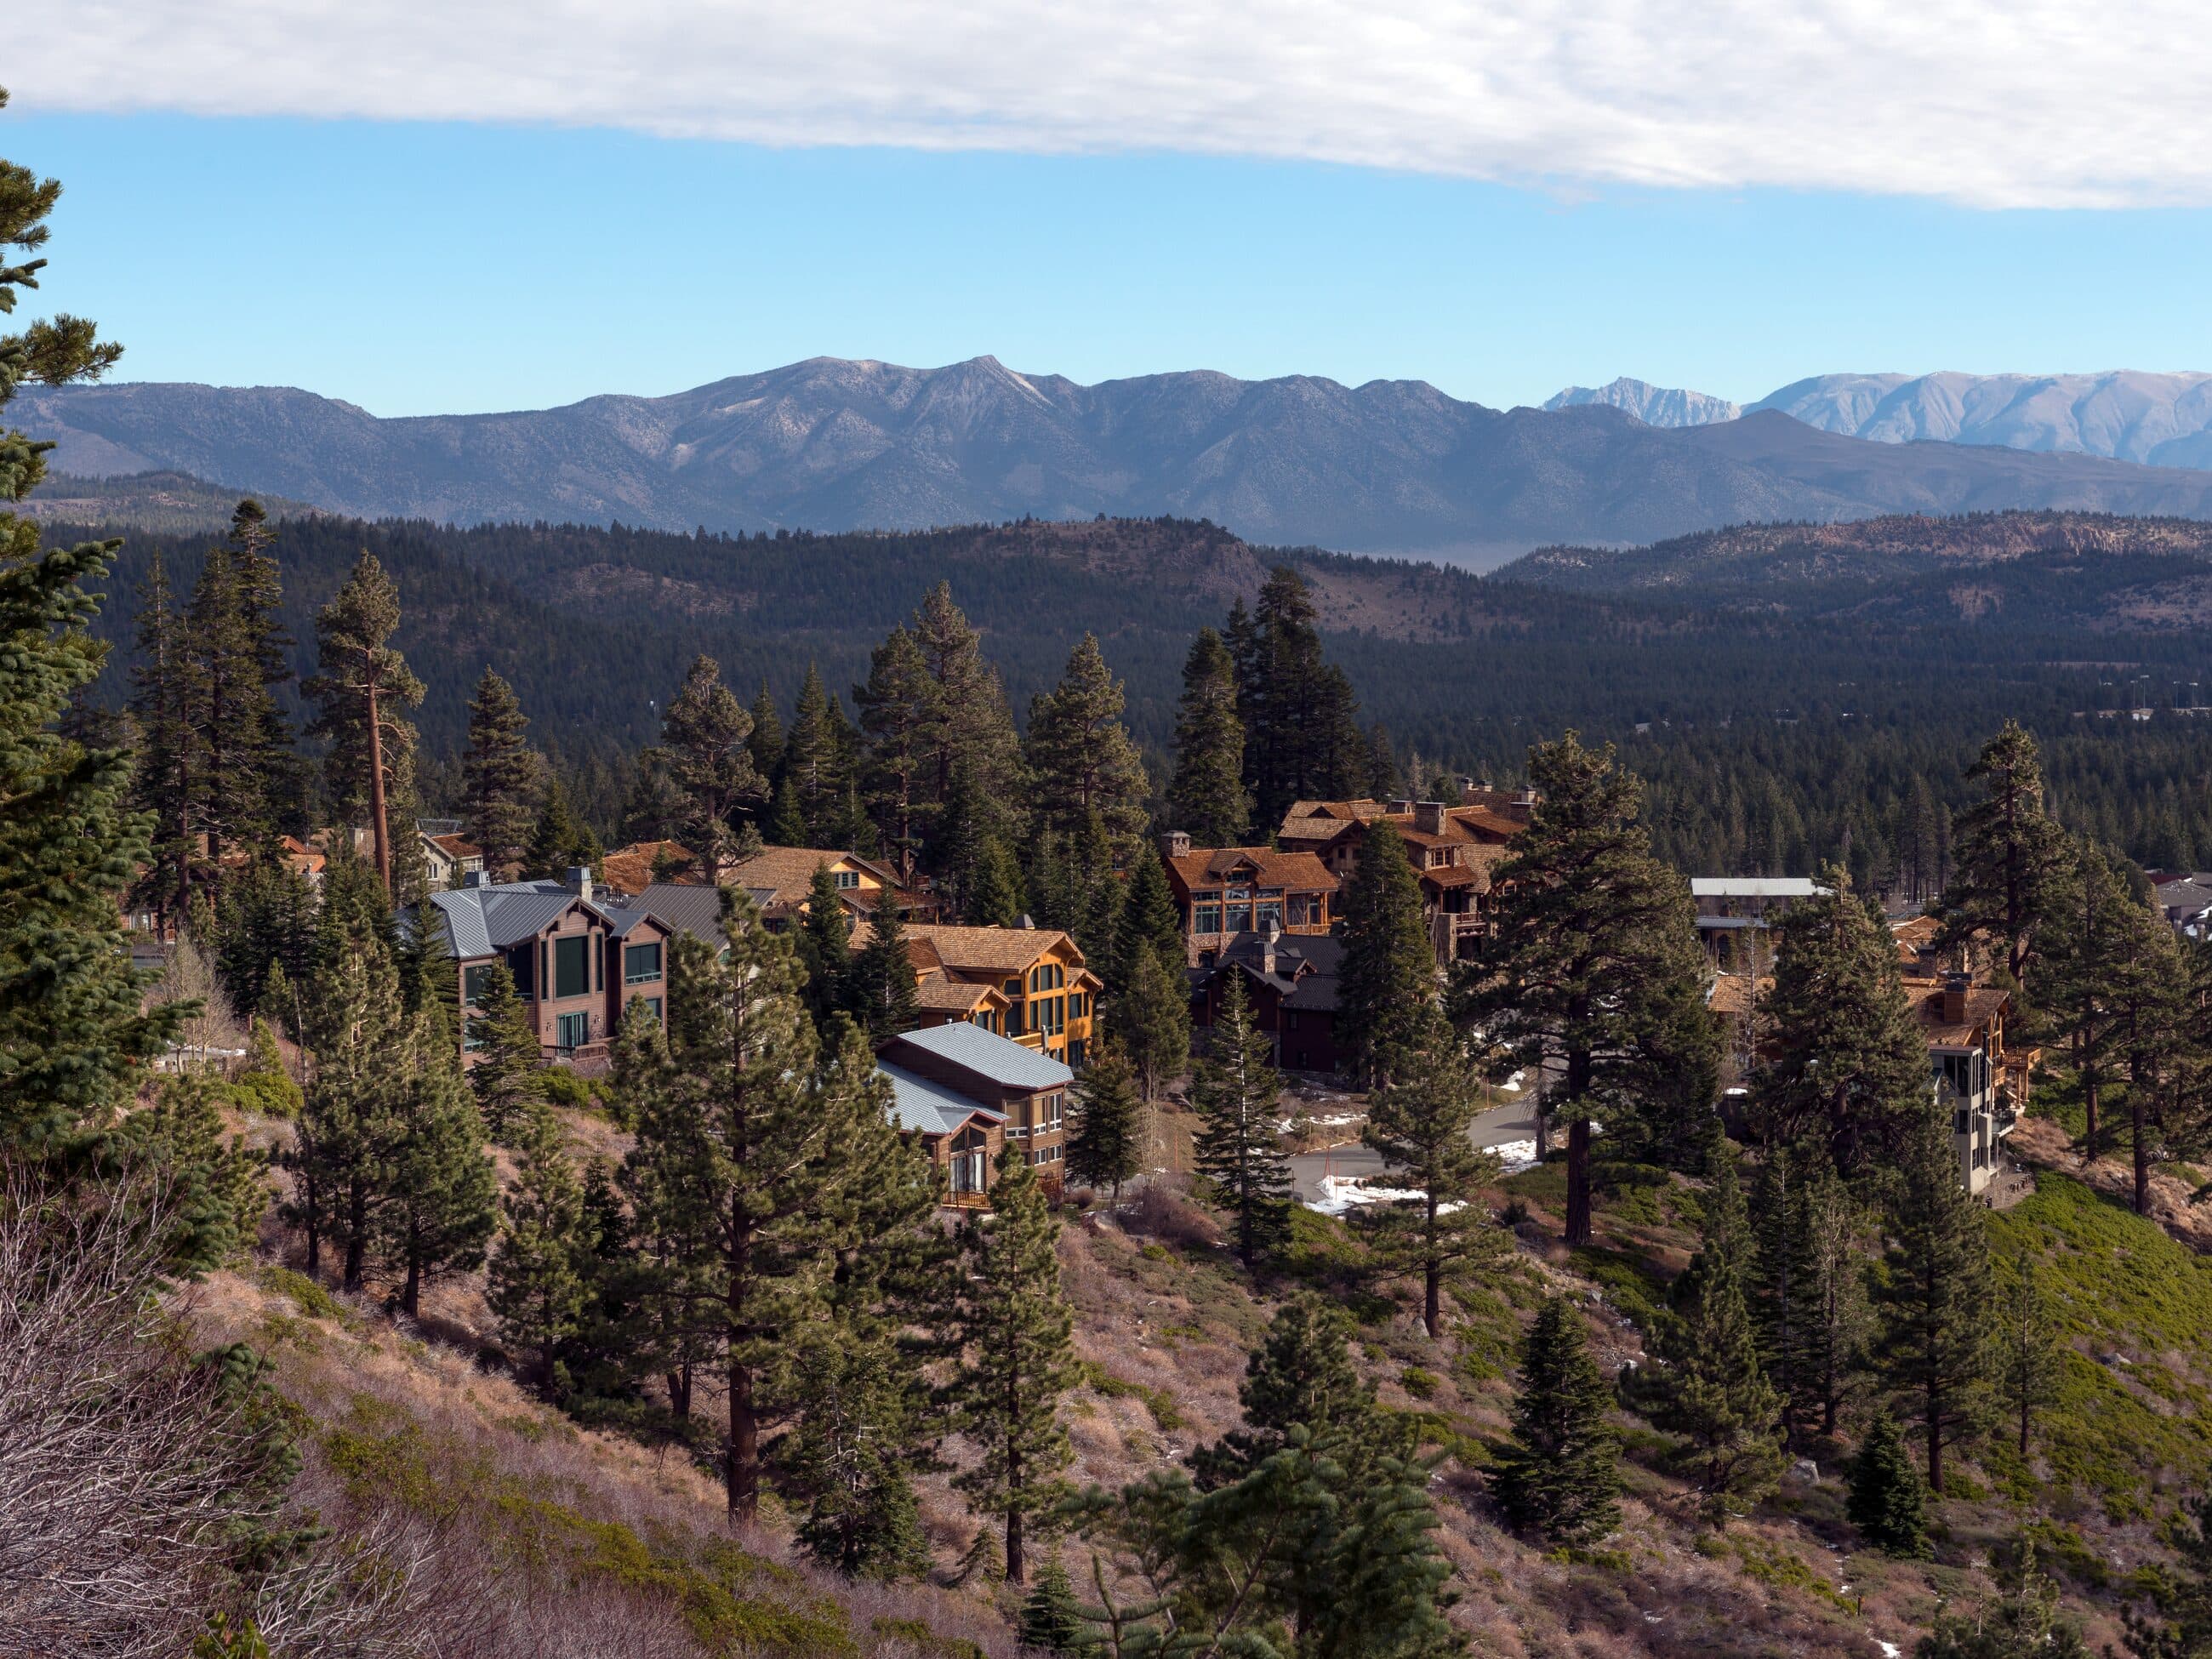
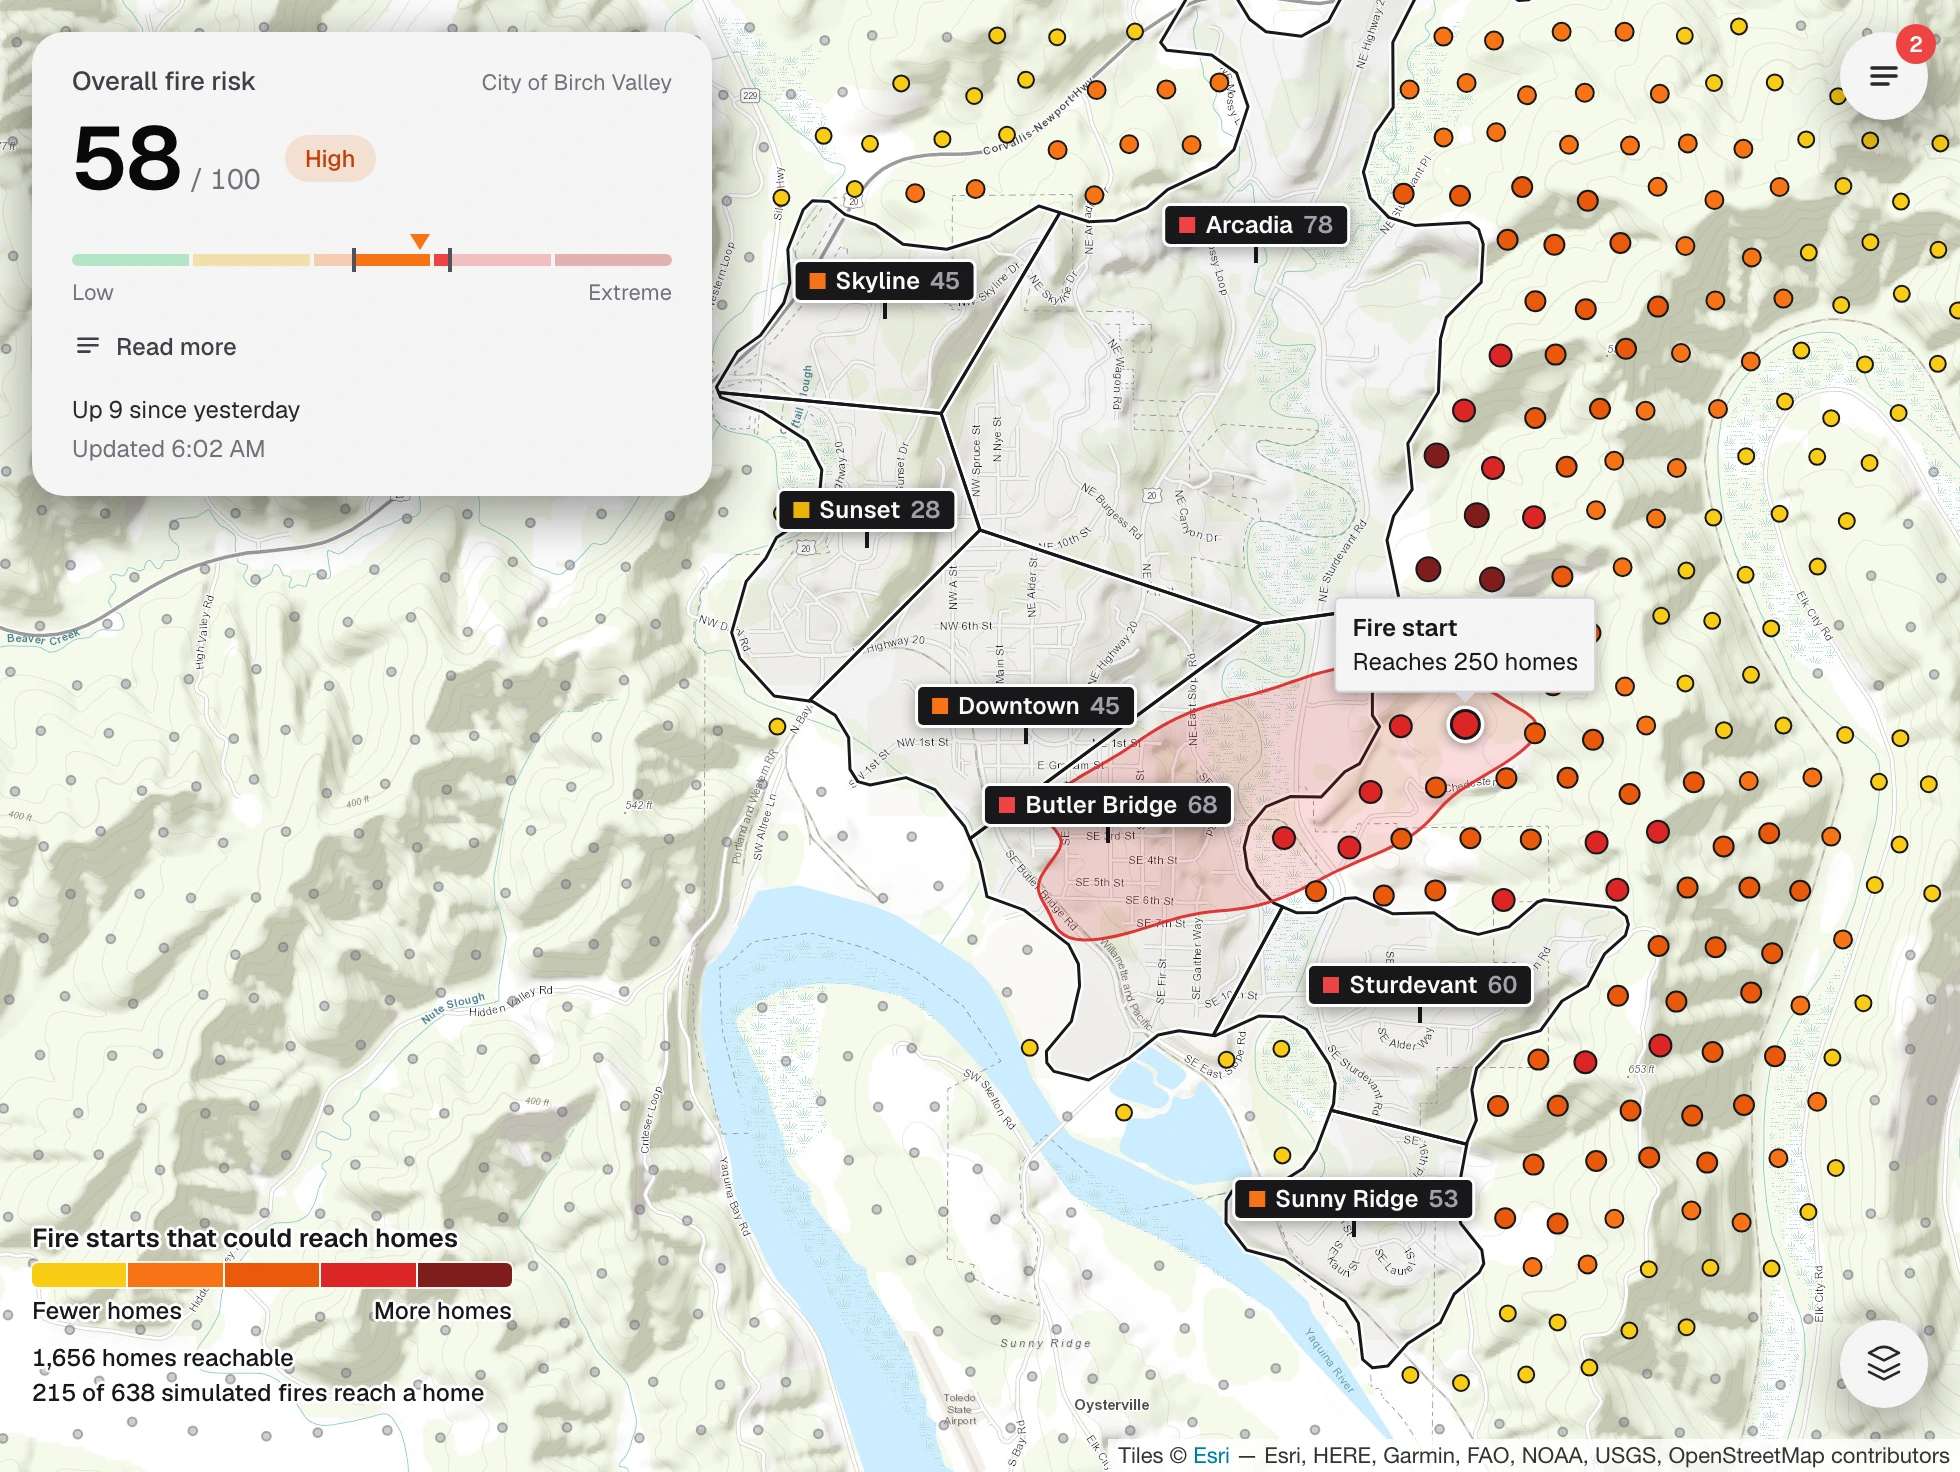
Wildfires are simulated from every point on the ignition grid and scored by the number and importance of the structures they reach. Those scores roll up into a wildfire risk score for each neighborhood.
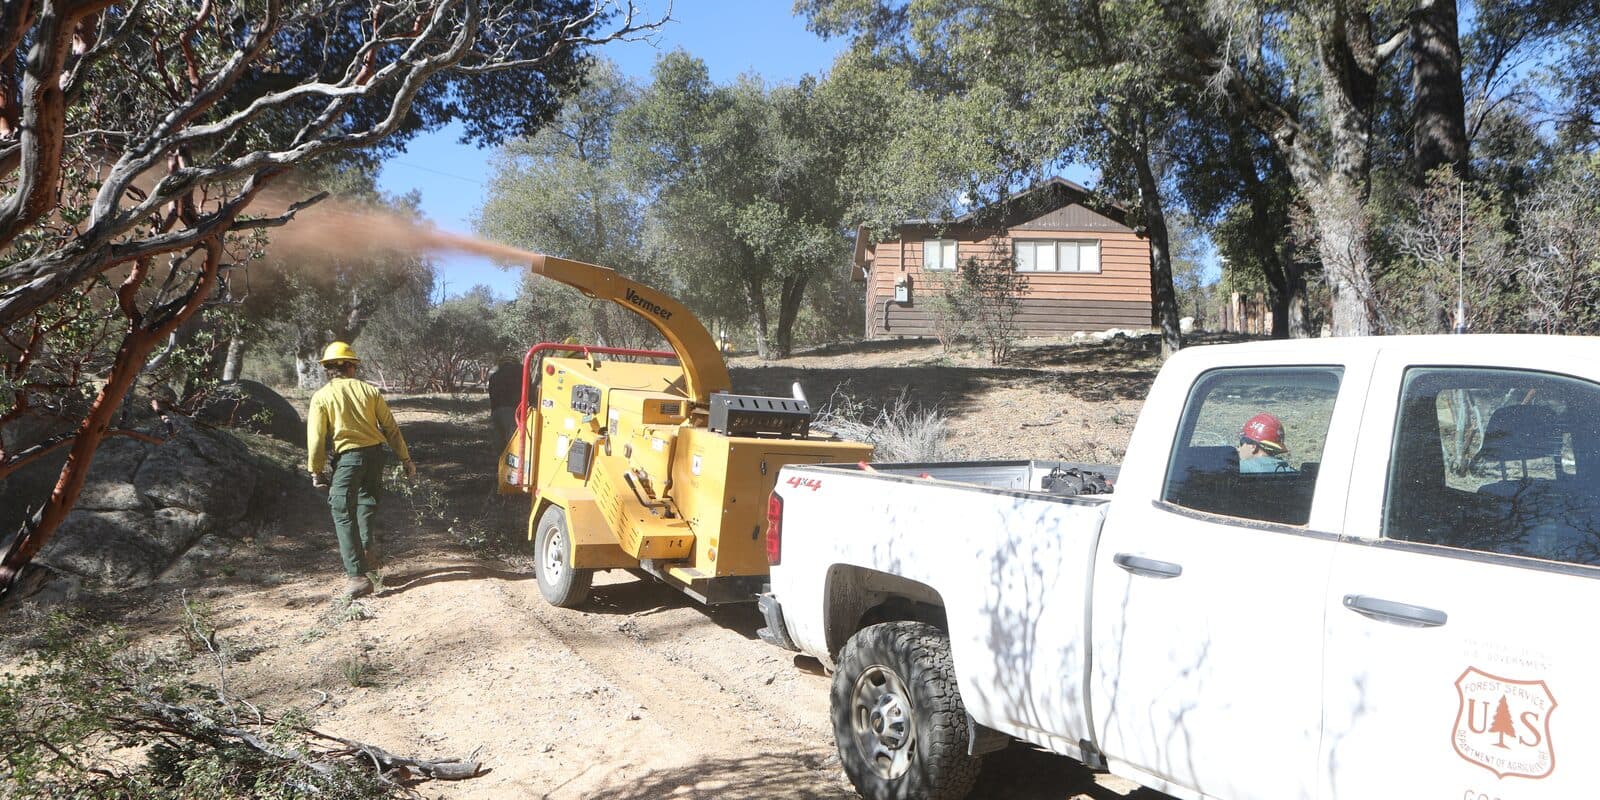
A static risk assessment built on historical conditions identifies the areas around the community best suited for fuel treatment, based on how many high-consequence wildfires start there.
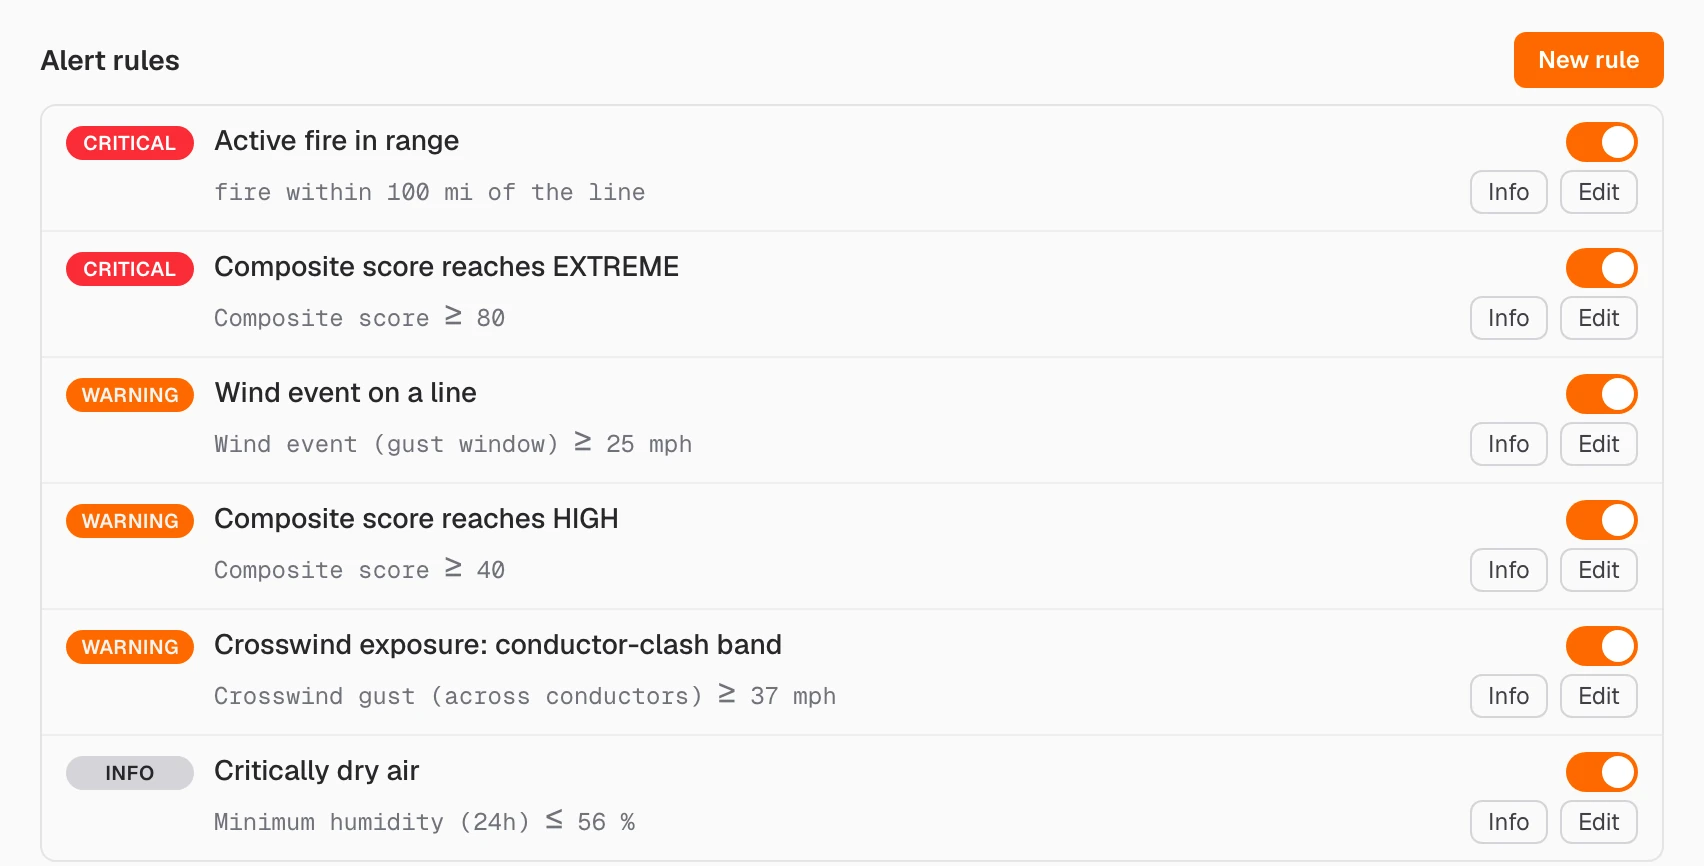
Risk scores refresh in sync with published weather forecast models and live observations from nearby weather stations. Alerts go out whenever elevated wildfire risk and behavior are detected.
Features
Risk scores, fire simulations, live fire tracking, alerts, and locked daily records are covered in full on the Features page.
FeaturesA walkthrough of neighborhood exposure and the daily outlook, scheduled with qualified teams during evaluation.