Features
Flarecast provides an overall risk score for all of your assets, as well as a breakdown by individual region, built from several factors. Throughout the day, it updates and tracks wildfire risk based on new weather forecast data, weather observations, and live fire activity.
Wildfire risk data is displayed transparently and stored as a locked daily record, ready for regulatory review.
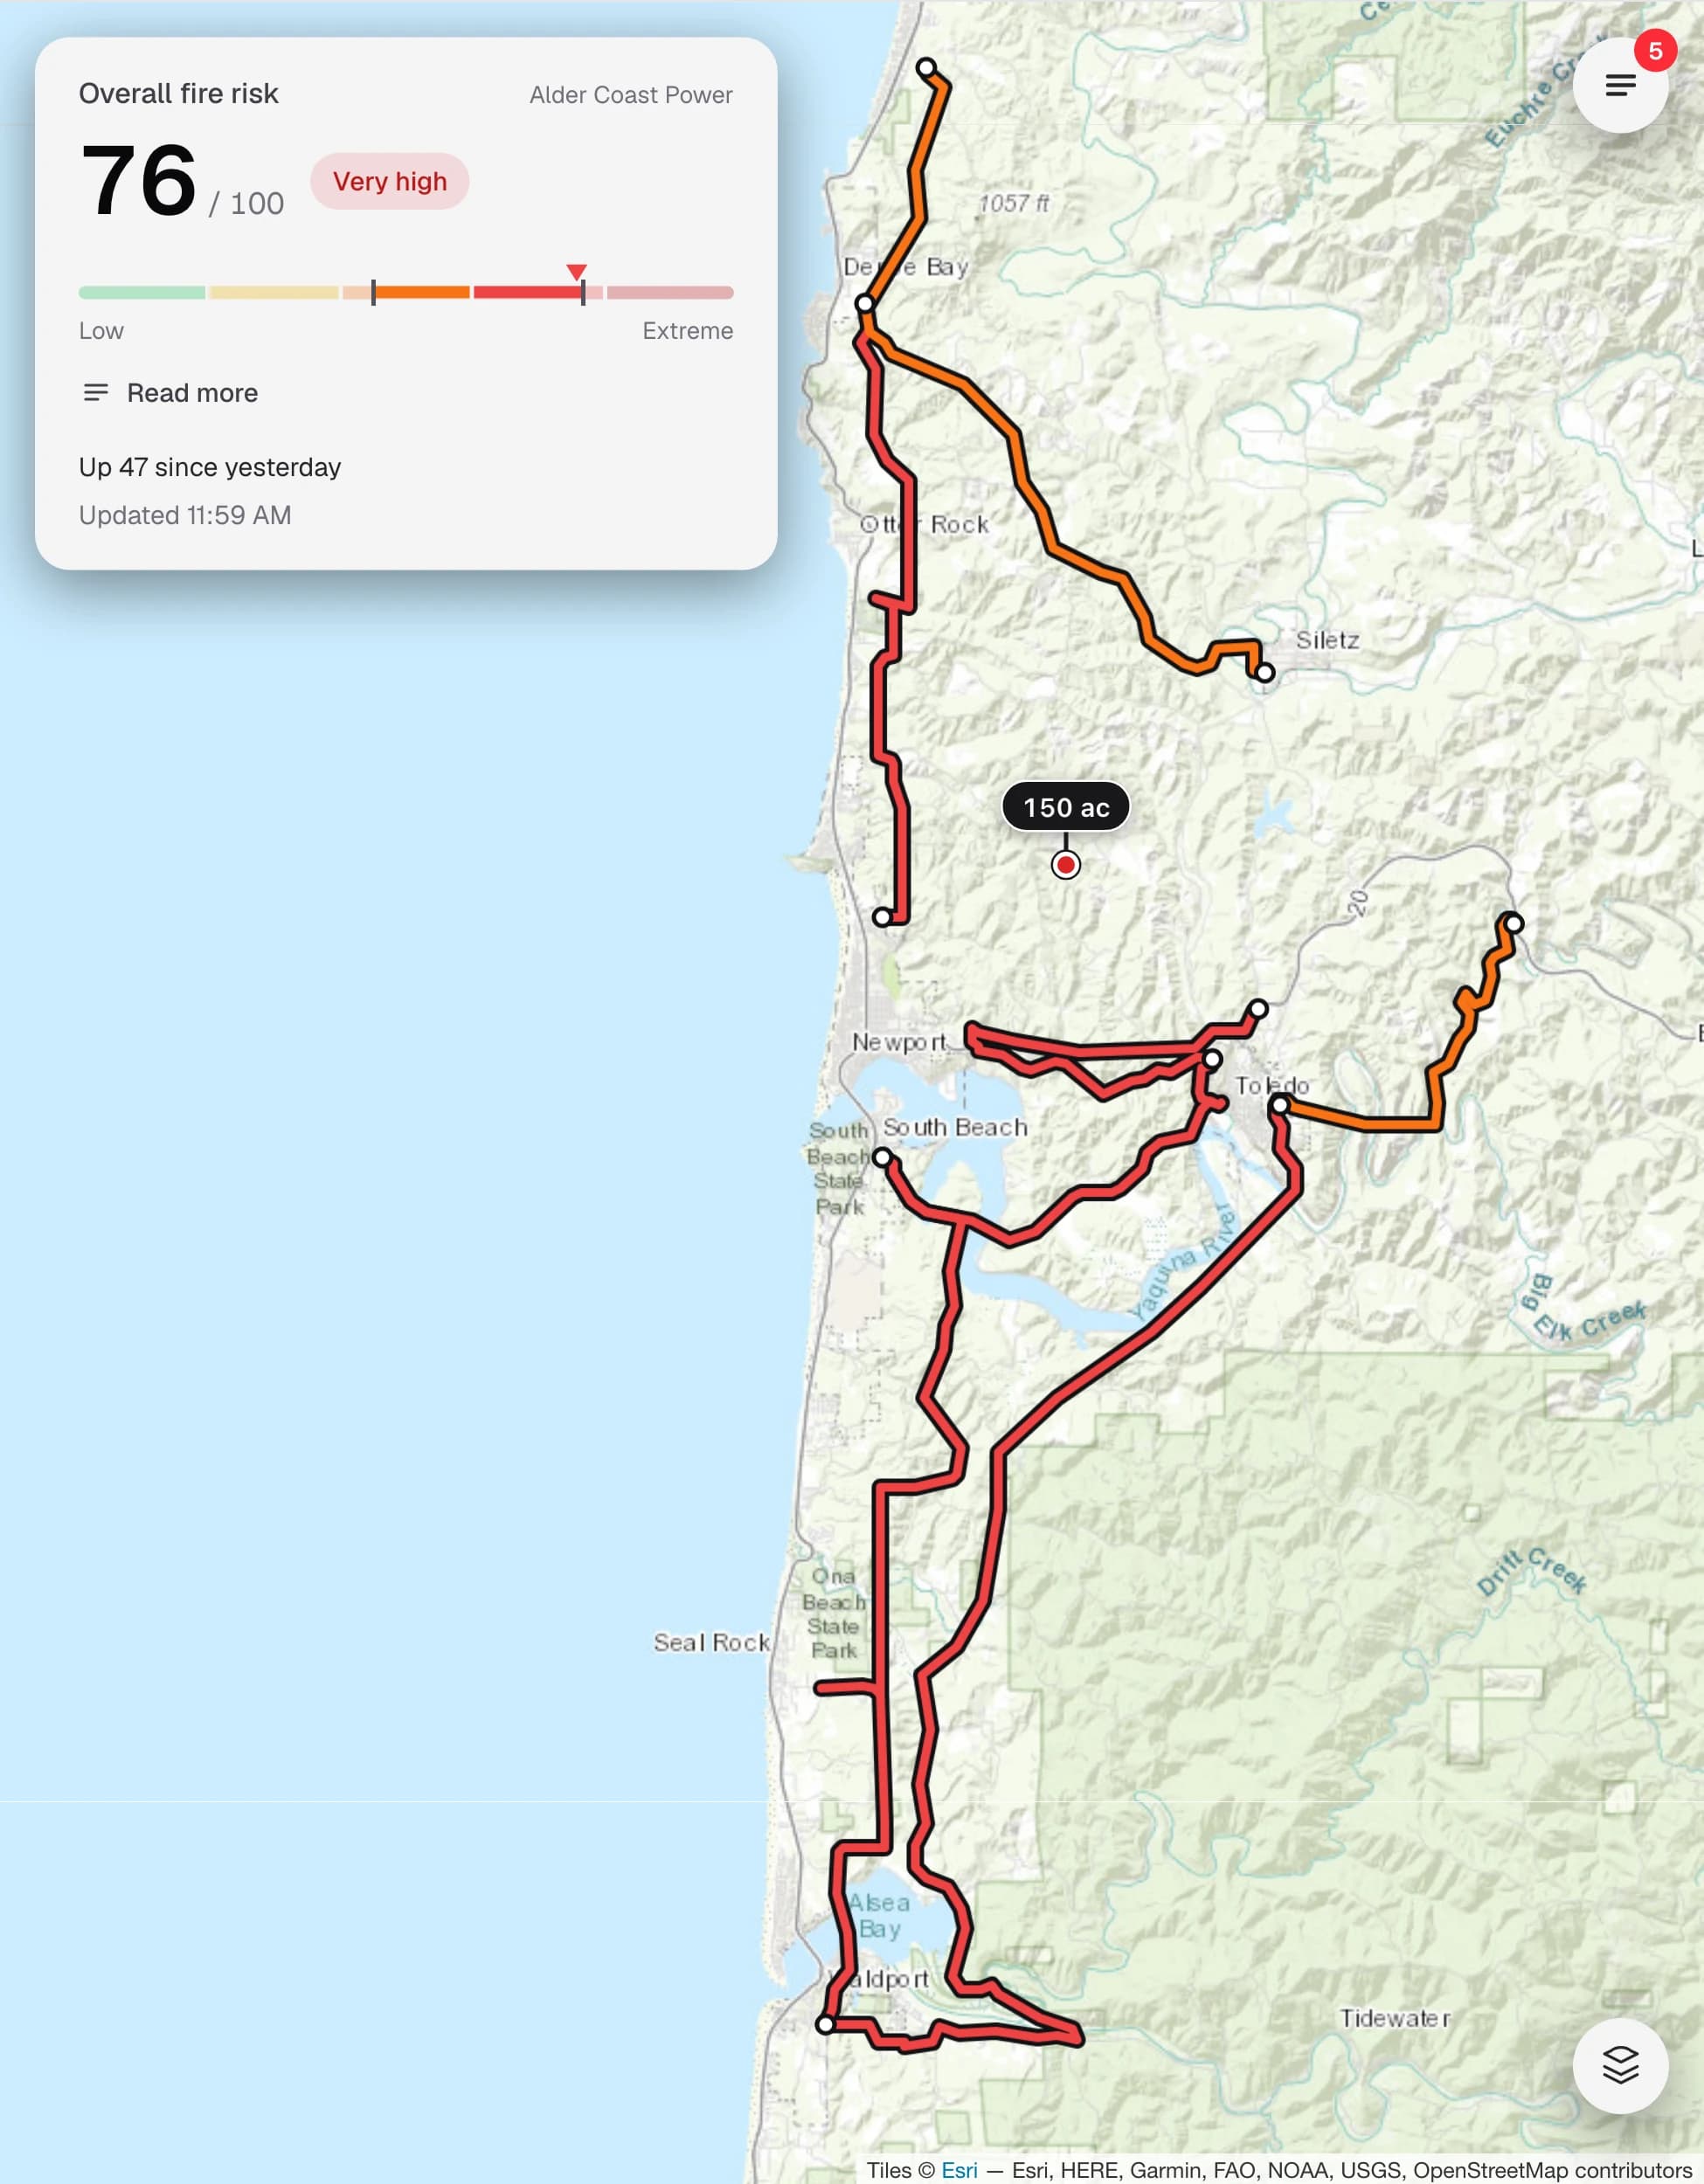
Real-time risk scores
Understand your risk throughout the day
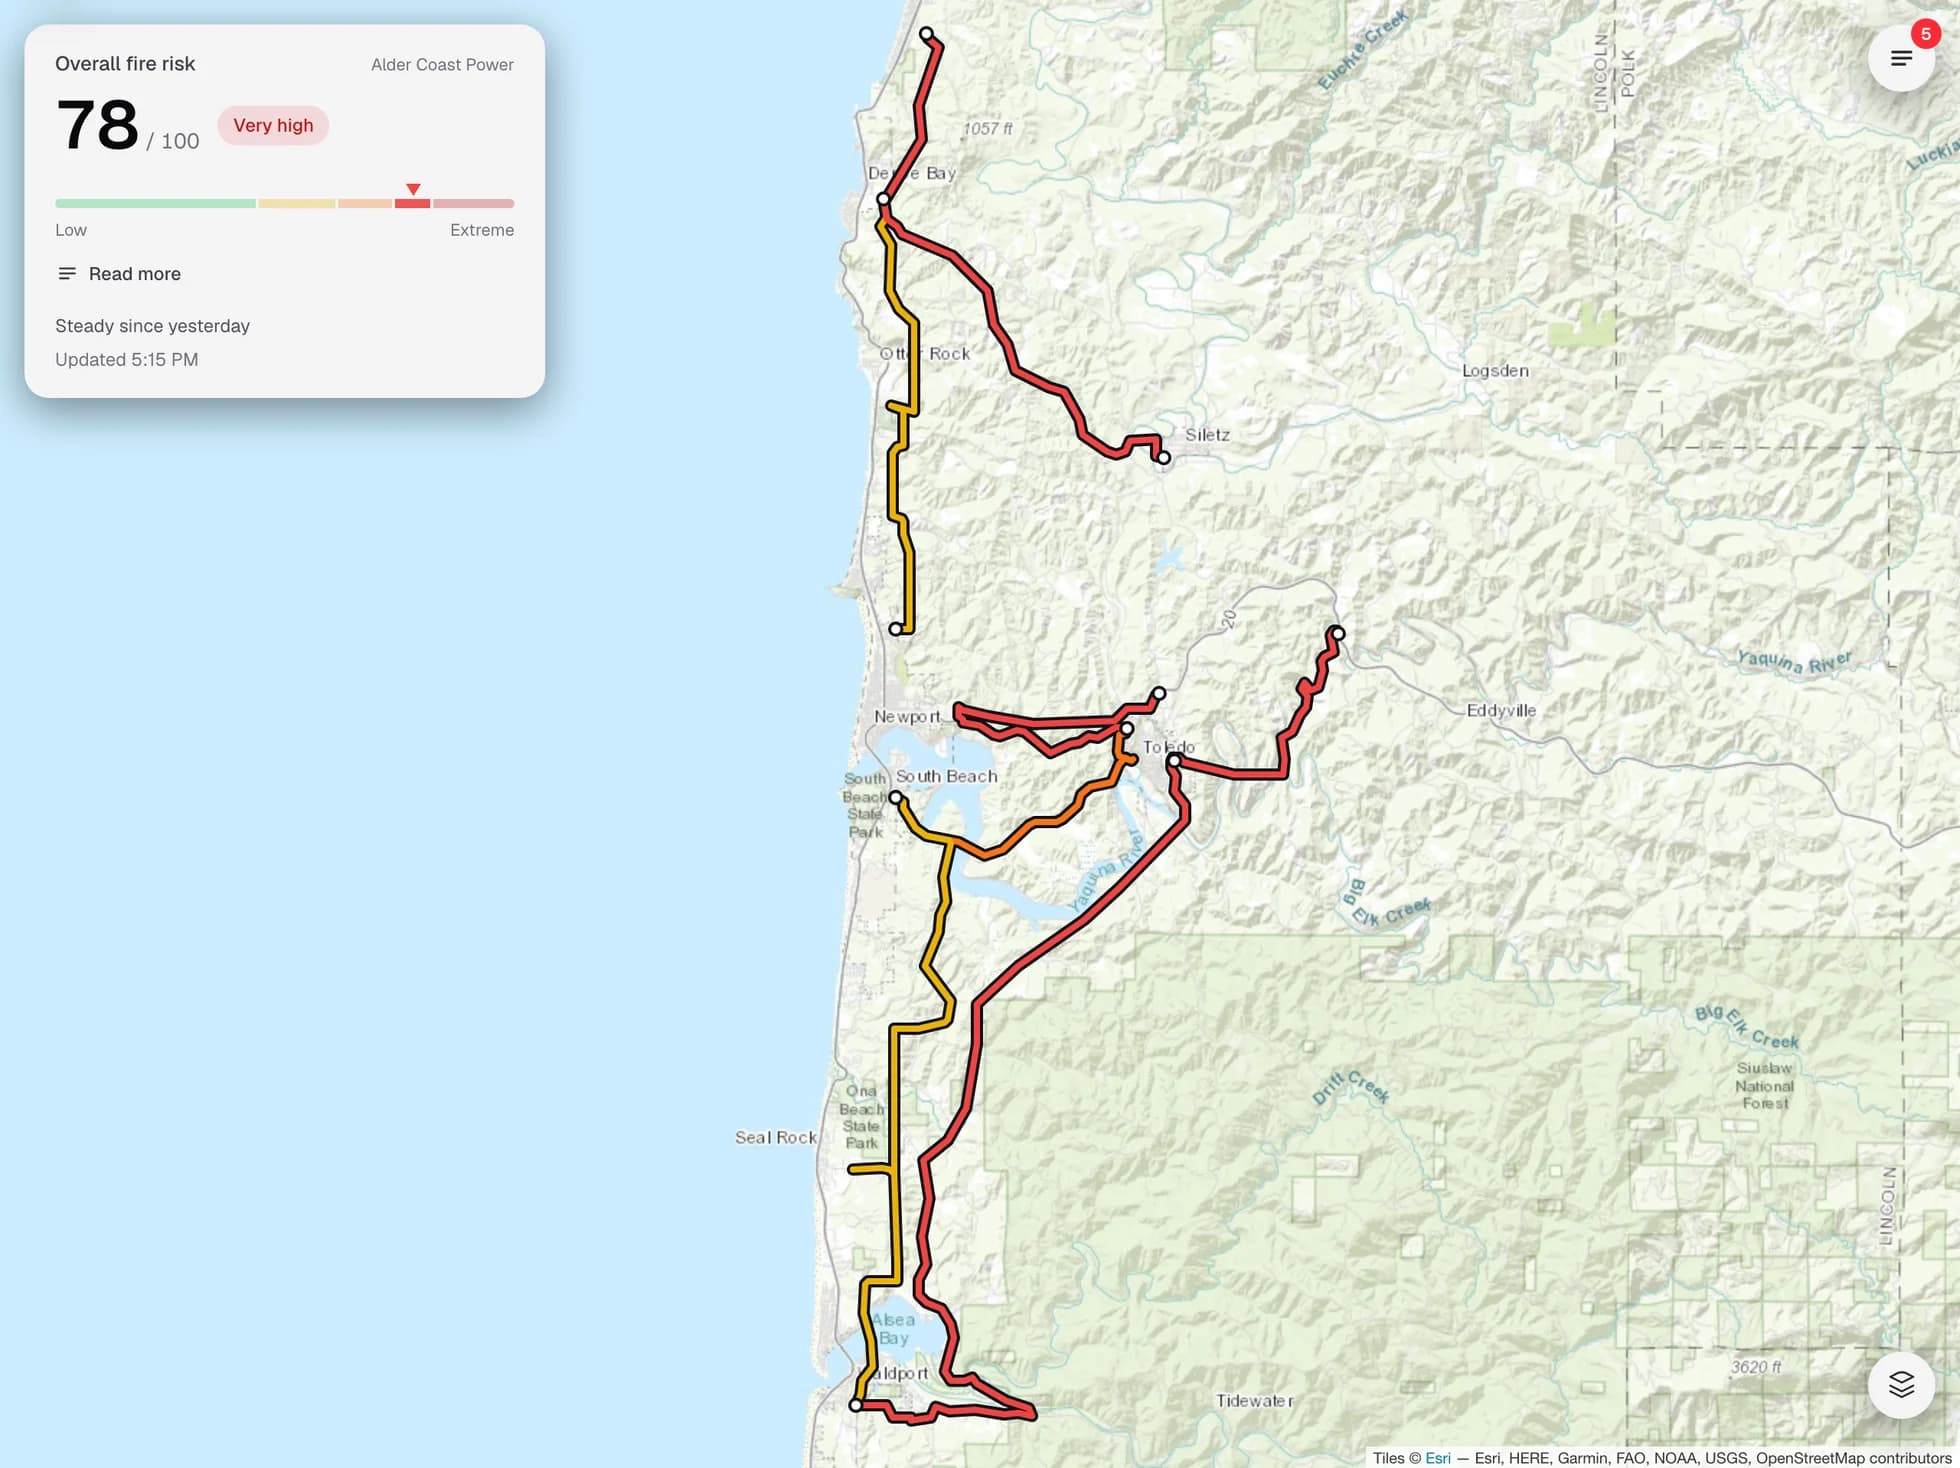
Flarecast breaks down the wildfire risk across your areas of interest.
- Summary risk score
- Each section gets an aggregate risk score from 0 to 100, with its risk level and a range showing the uncertainty in the score.
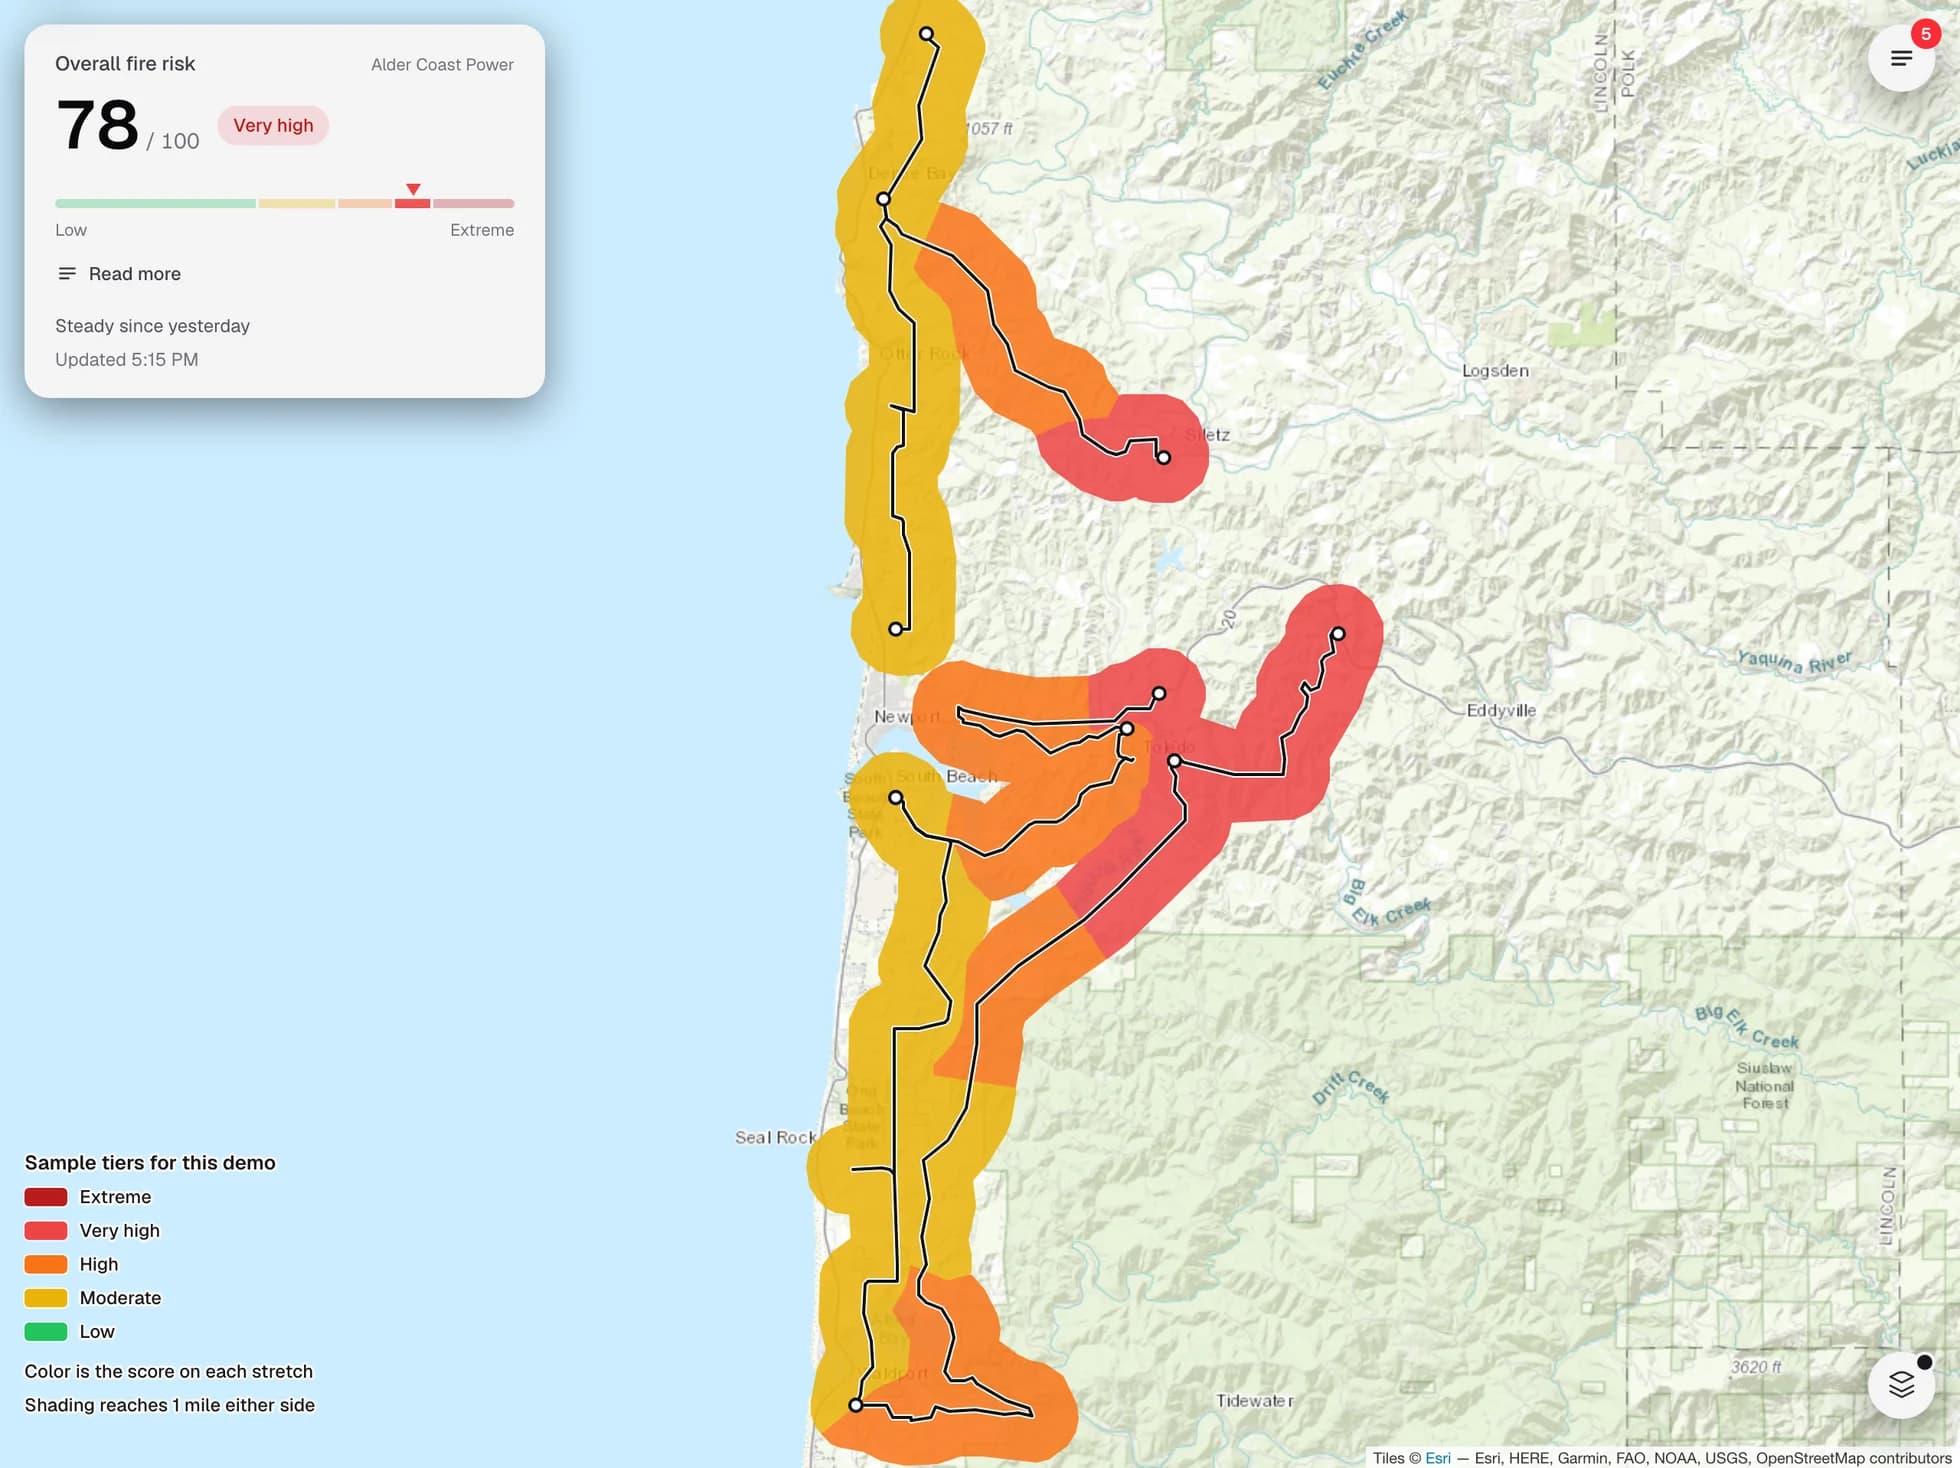
- Risk areas
- The map shades a mile either side of each line in the color of each stretch's score, showing where risk concentrates across your territory.
- Defensibility
- Every score explicitly explains which factors are contributing to the risk. Natural language summaries are available for a quick read-through.
- Wildfire risk forecast
- A five-day wildfire risk outlook showing how your wildfire risk evolves over time.
Fire growth modeling
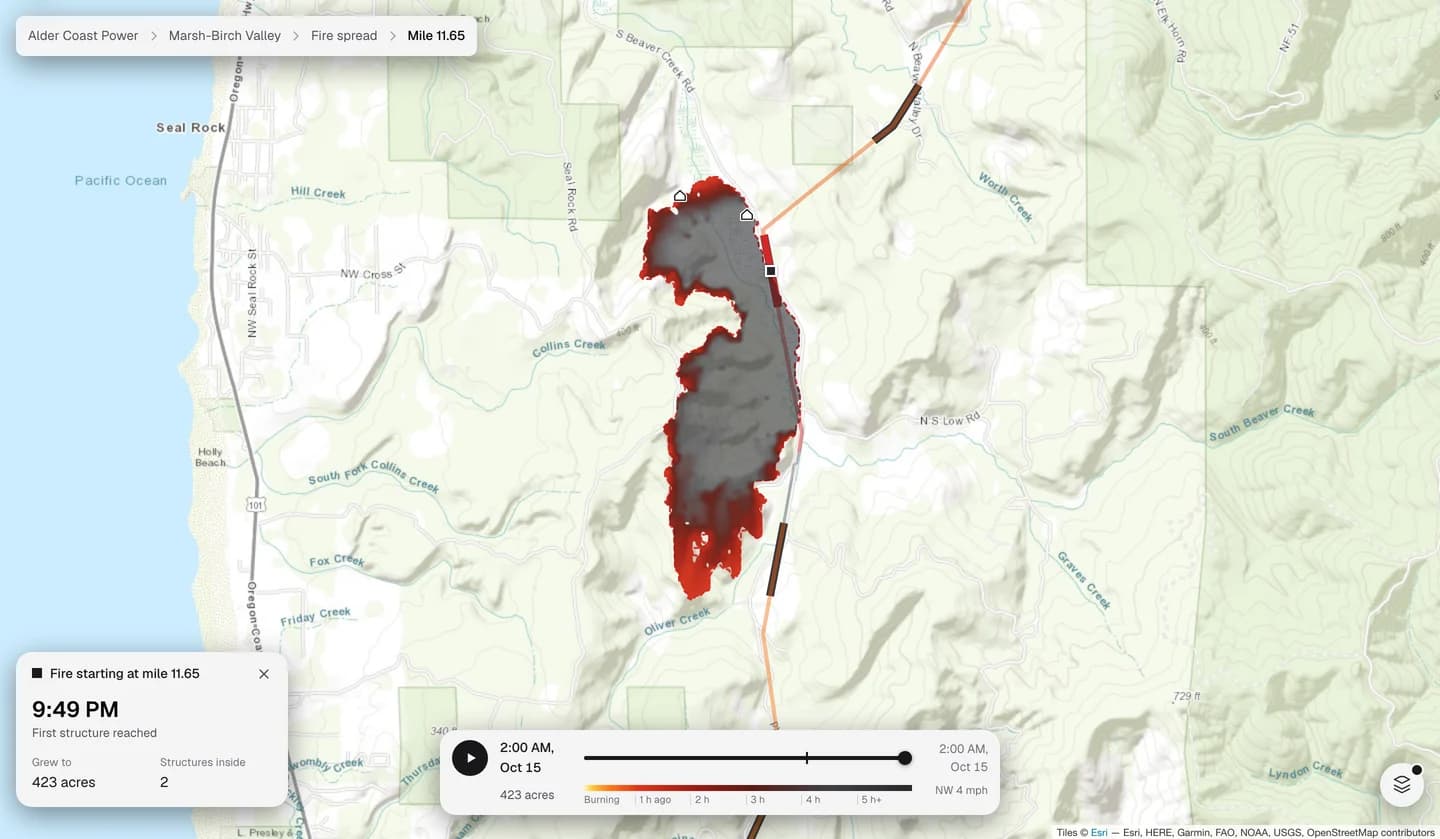
Modeled wildfire growth along your assets
Flarecast models wildfire ignitions at regular intervals across your infrastructure.
- Play back wildfire spread
- View the modeled spread hour by hour, interactively on the map.
- Ember risk
- Flarecast also models where embers could land, at a range far past the fire front.
- Structures at risk
- View the structures that each simulated fire exposes to damage, and the estimated time of arrival at each structure from the time of ignition.
Active fire tracking
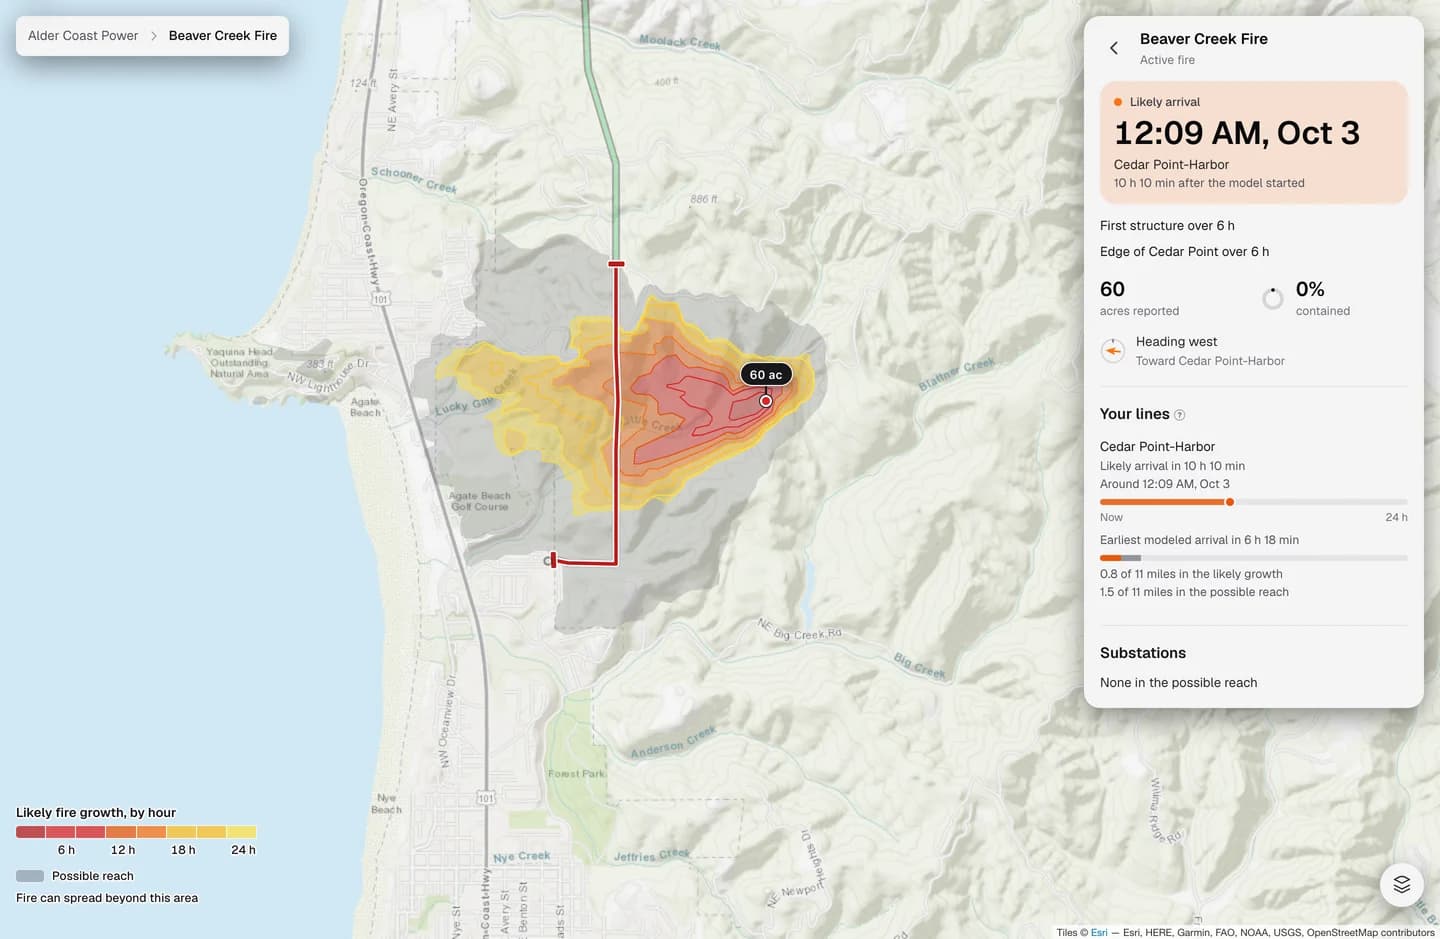
View and model live fires
We supply real-time modeling of any wildfire that could be at risk of burning your assets.
- Forecast wildfire modeling for every nearby fire
- Every active fire near your assets gets a regularly produced 24-hour spread forecast.
- Hourly spread view
- Break down the wildfire growth hour by hour to see when the fire may impact areas around your infrastructure.
Alerts
Flarecast is alert-driven
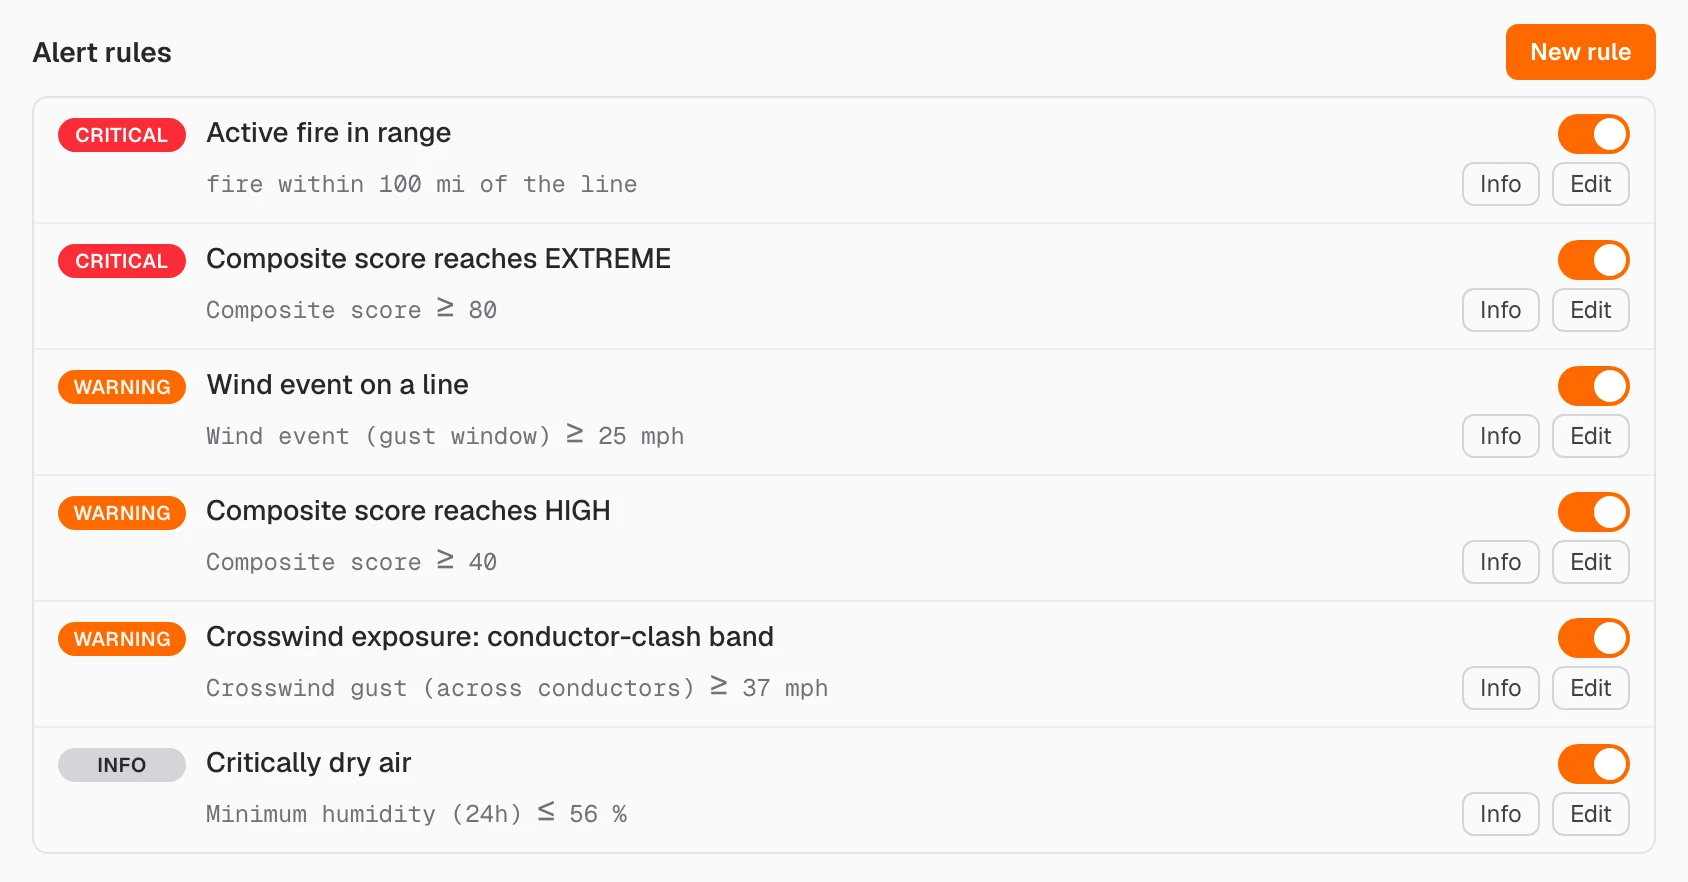
Don't rely on manual information gathering. Flarecast's alerts provide you with what you need to know, when you need to know it, across multiple domains.
- Custom thresholds
- Set custom alert thresholds based on any wildfire risk factor, such as weather, fuel, fire behavior, or the Flarecast risk score that combines all of these factors. Alerts come in three levels (Info, Warning and Critical), and you choose how each level reaches decision makers' desks.
- Escalating and de-escalating alerts
- Flarecast tells you when an asset moves into a higher risk level, and again when it drops back down, so you always know how conditions are changing across your areas.
Record keeping
A defensible record for regulators
Regulators expect co-ops and municipal utilities to explain how they assessed wildfire risk. Flarecast keeps detailed records to assist their auditing.
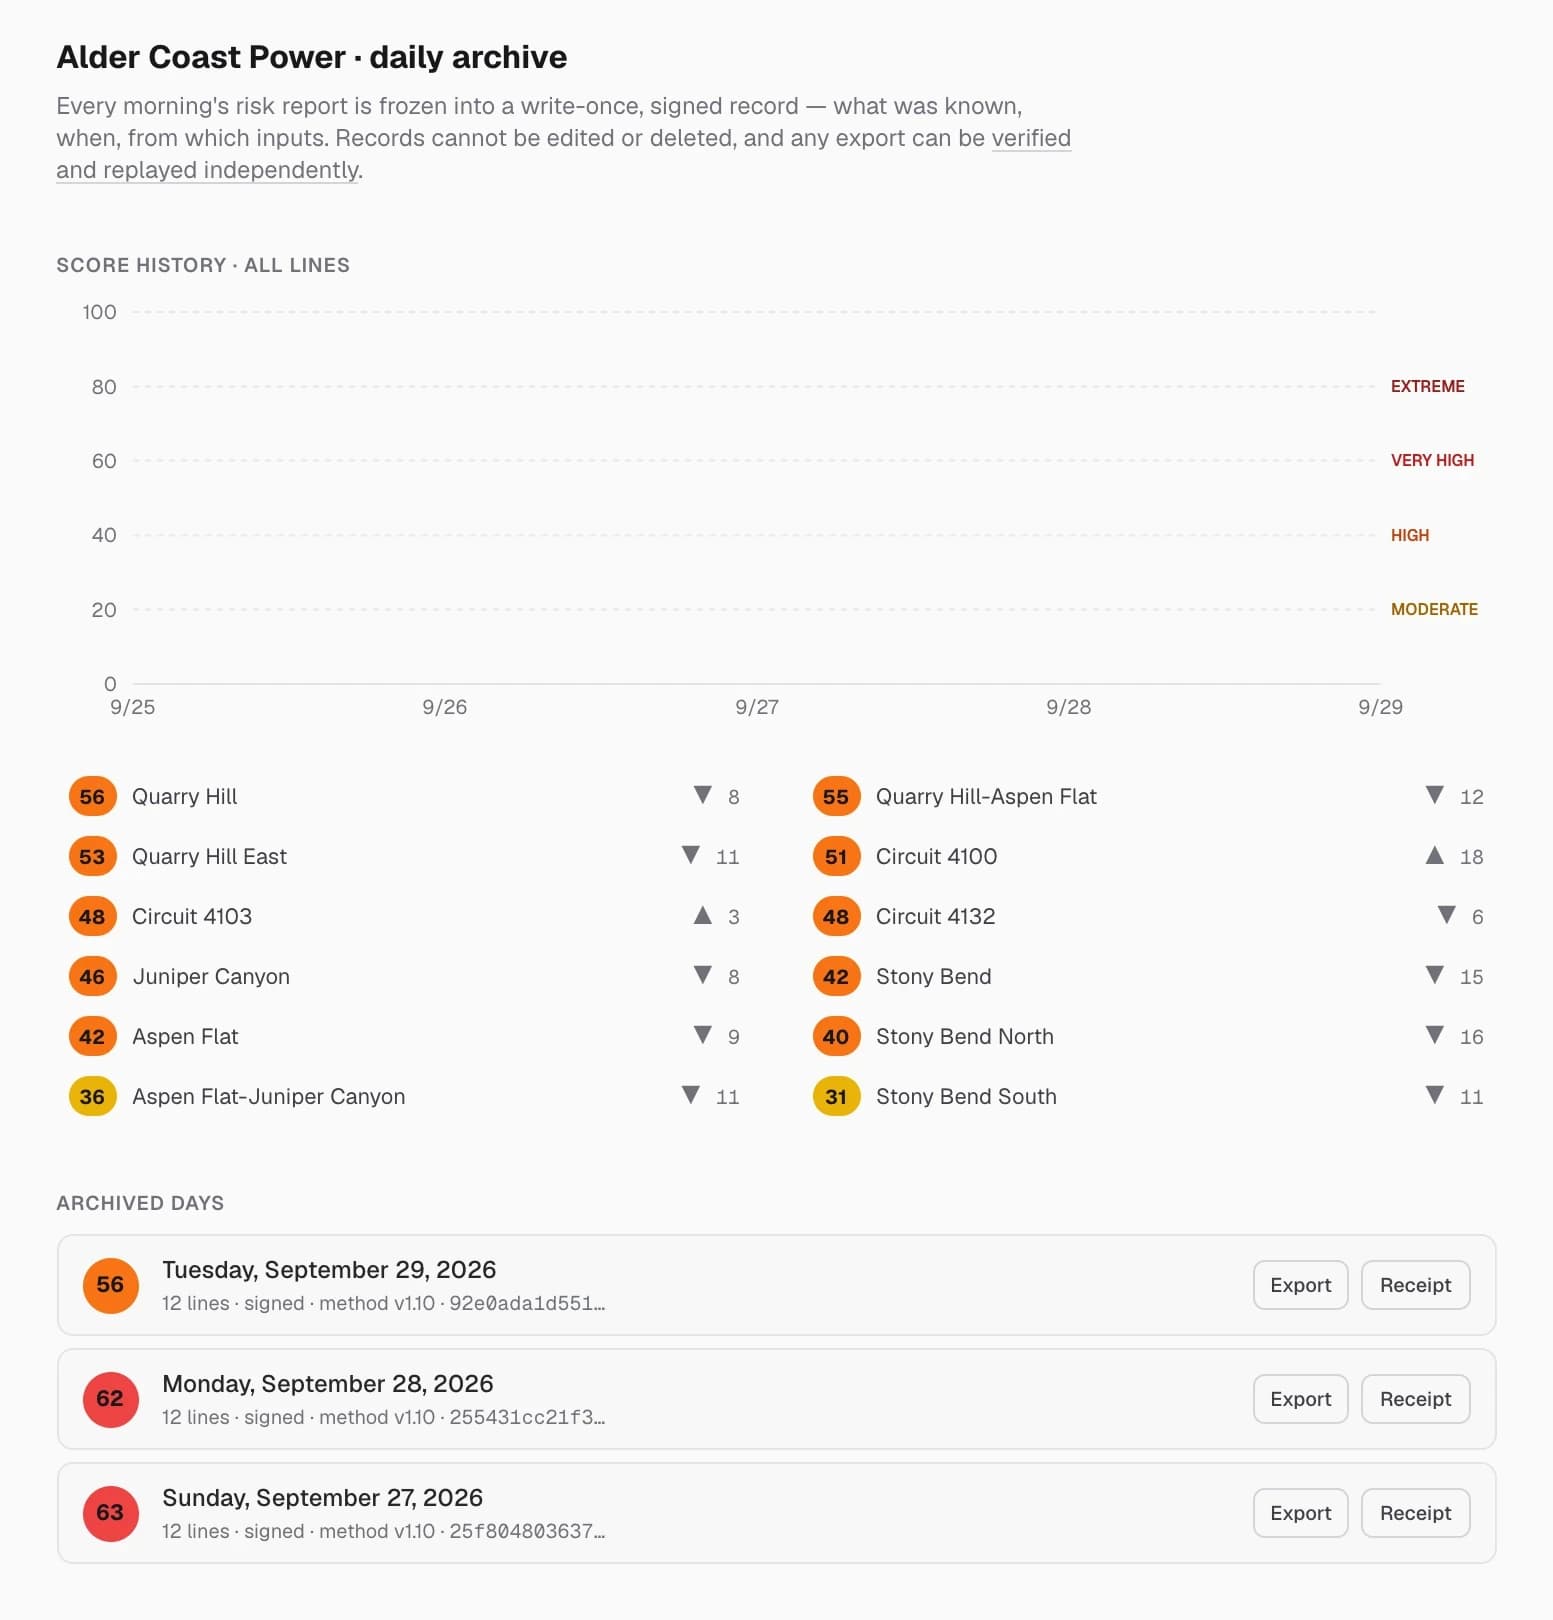
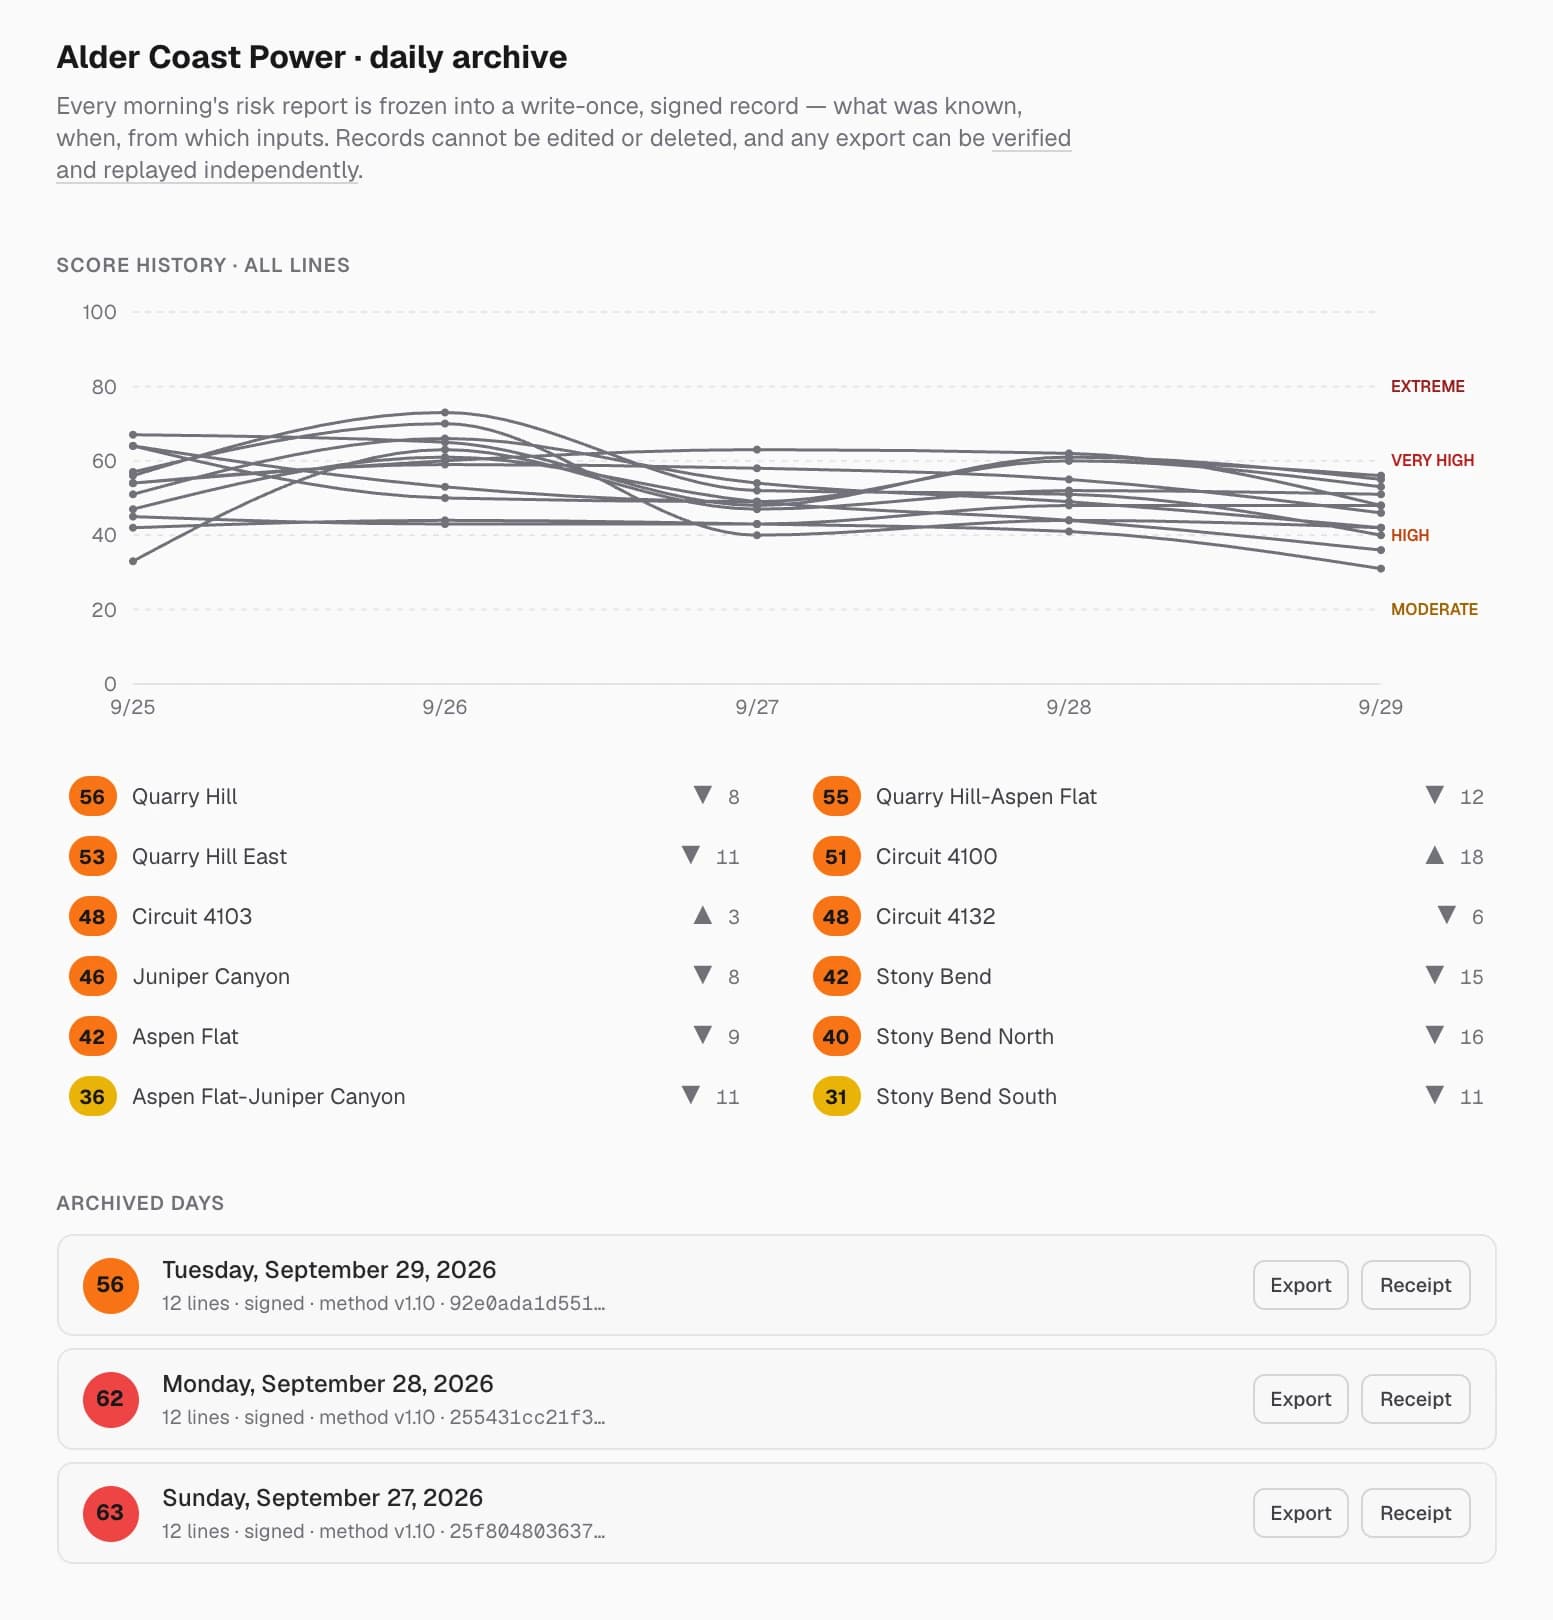
- Locked daily records
- The data behind every risk score, including wildfire growth modeling, is saved, signed, and locked each day, so records can't be changed later on, maintaining consistency for regulatory review.
- Replays available for any previous day
- Rerun a past day's wildfire risk modeling from the inputs saved that day, to show exactly what the data said when a decision was made.
- View score history
- Visualize any region's wildfire risk over time.
See these features in a live demo.
A walkthrough of the morning report, fire simulations, and alert rules, scheduled with qualified teams during evaluation.