
Thousands of fires modeled along your infrastructure, capturing the risk of a major spread event.
Assess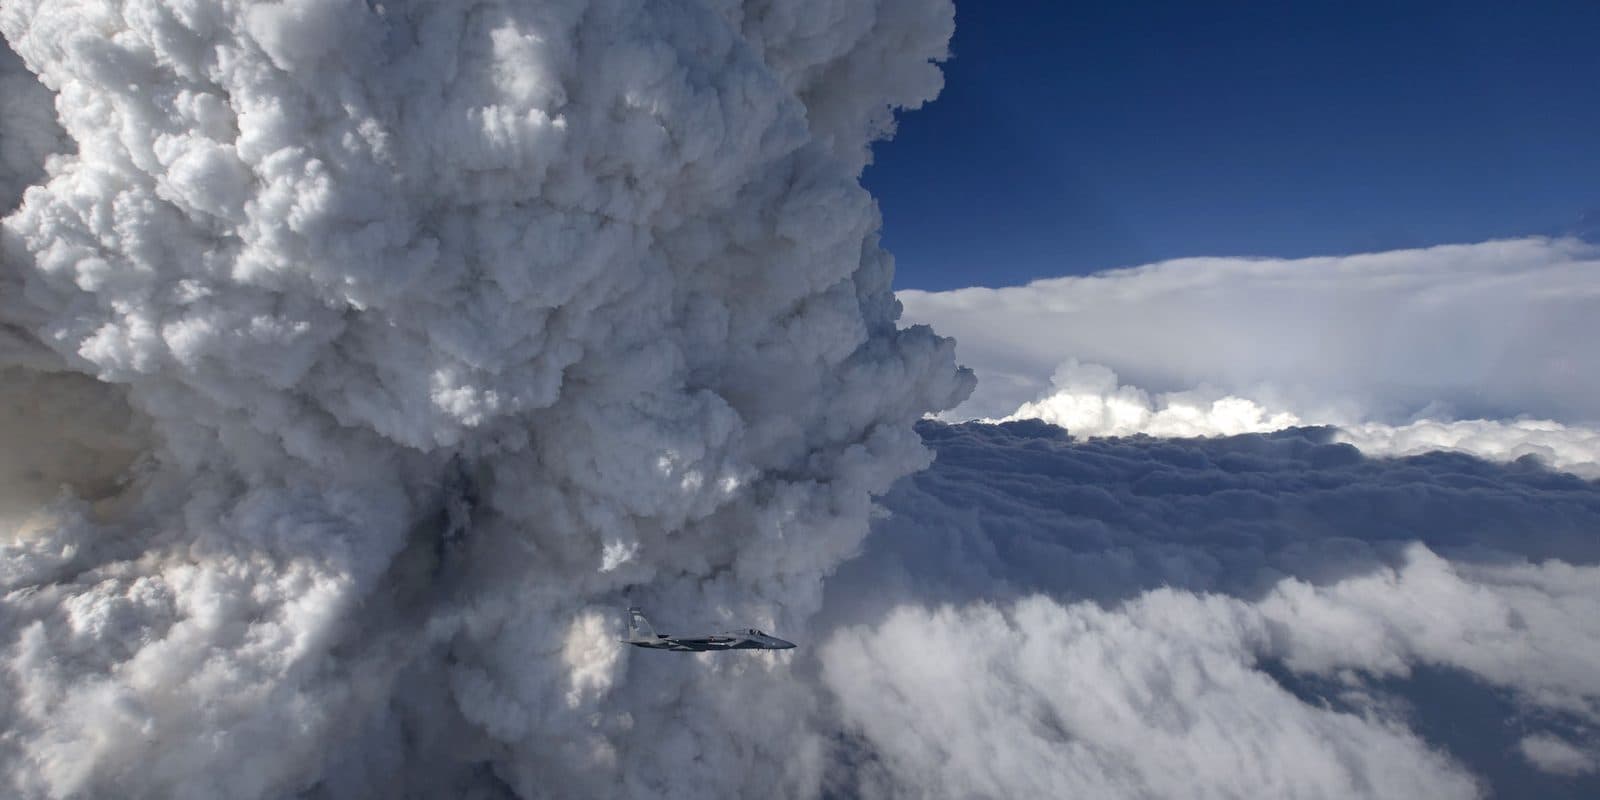
Early Access
Utilities
Risk scored span by span along your own infrastructure, from ignition through spread to the values a fire would reach.
It runs on the GIS data you already hold and the thresholds your procedures already set, from the morning status update down to a deep dive on a single span.
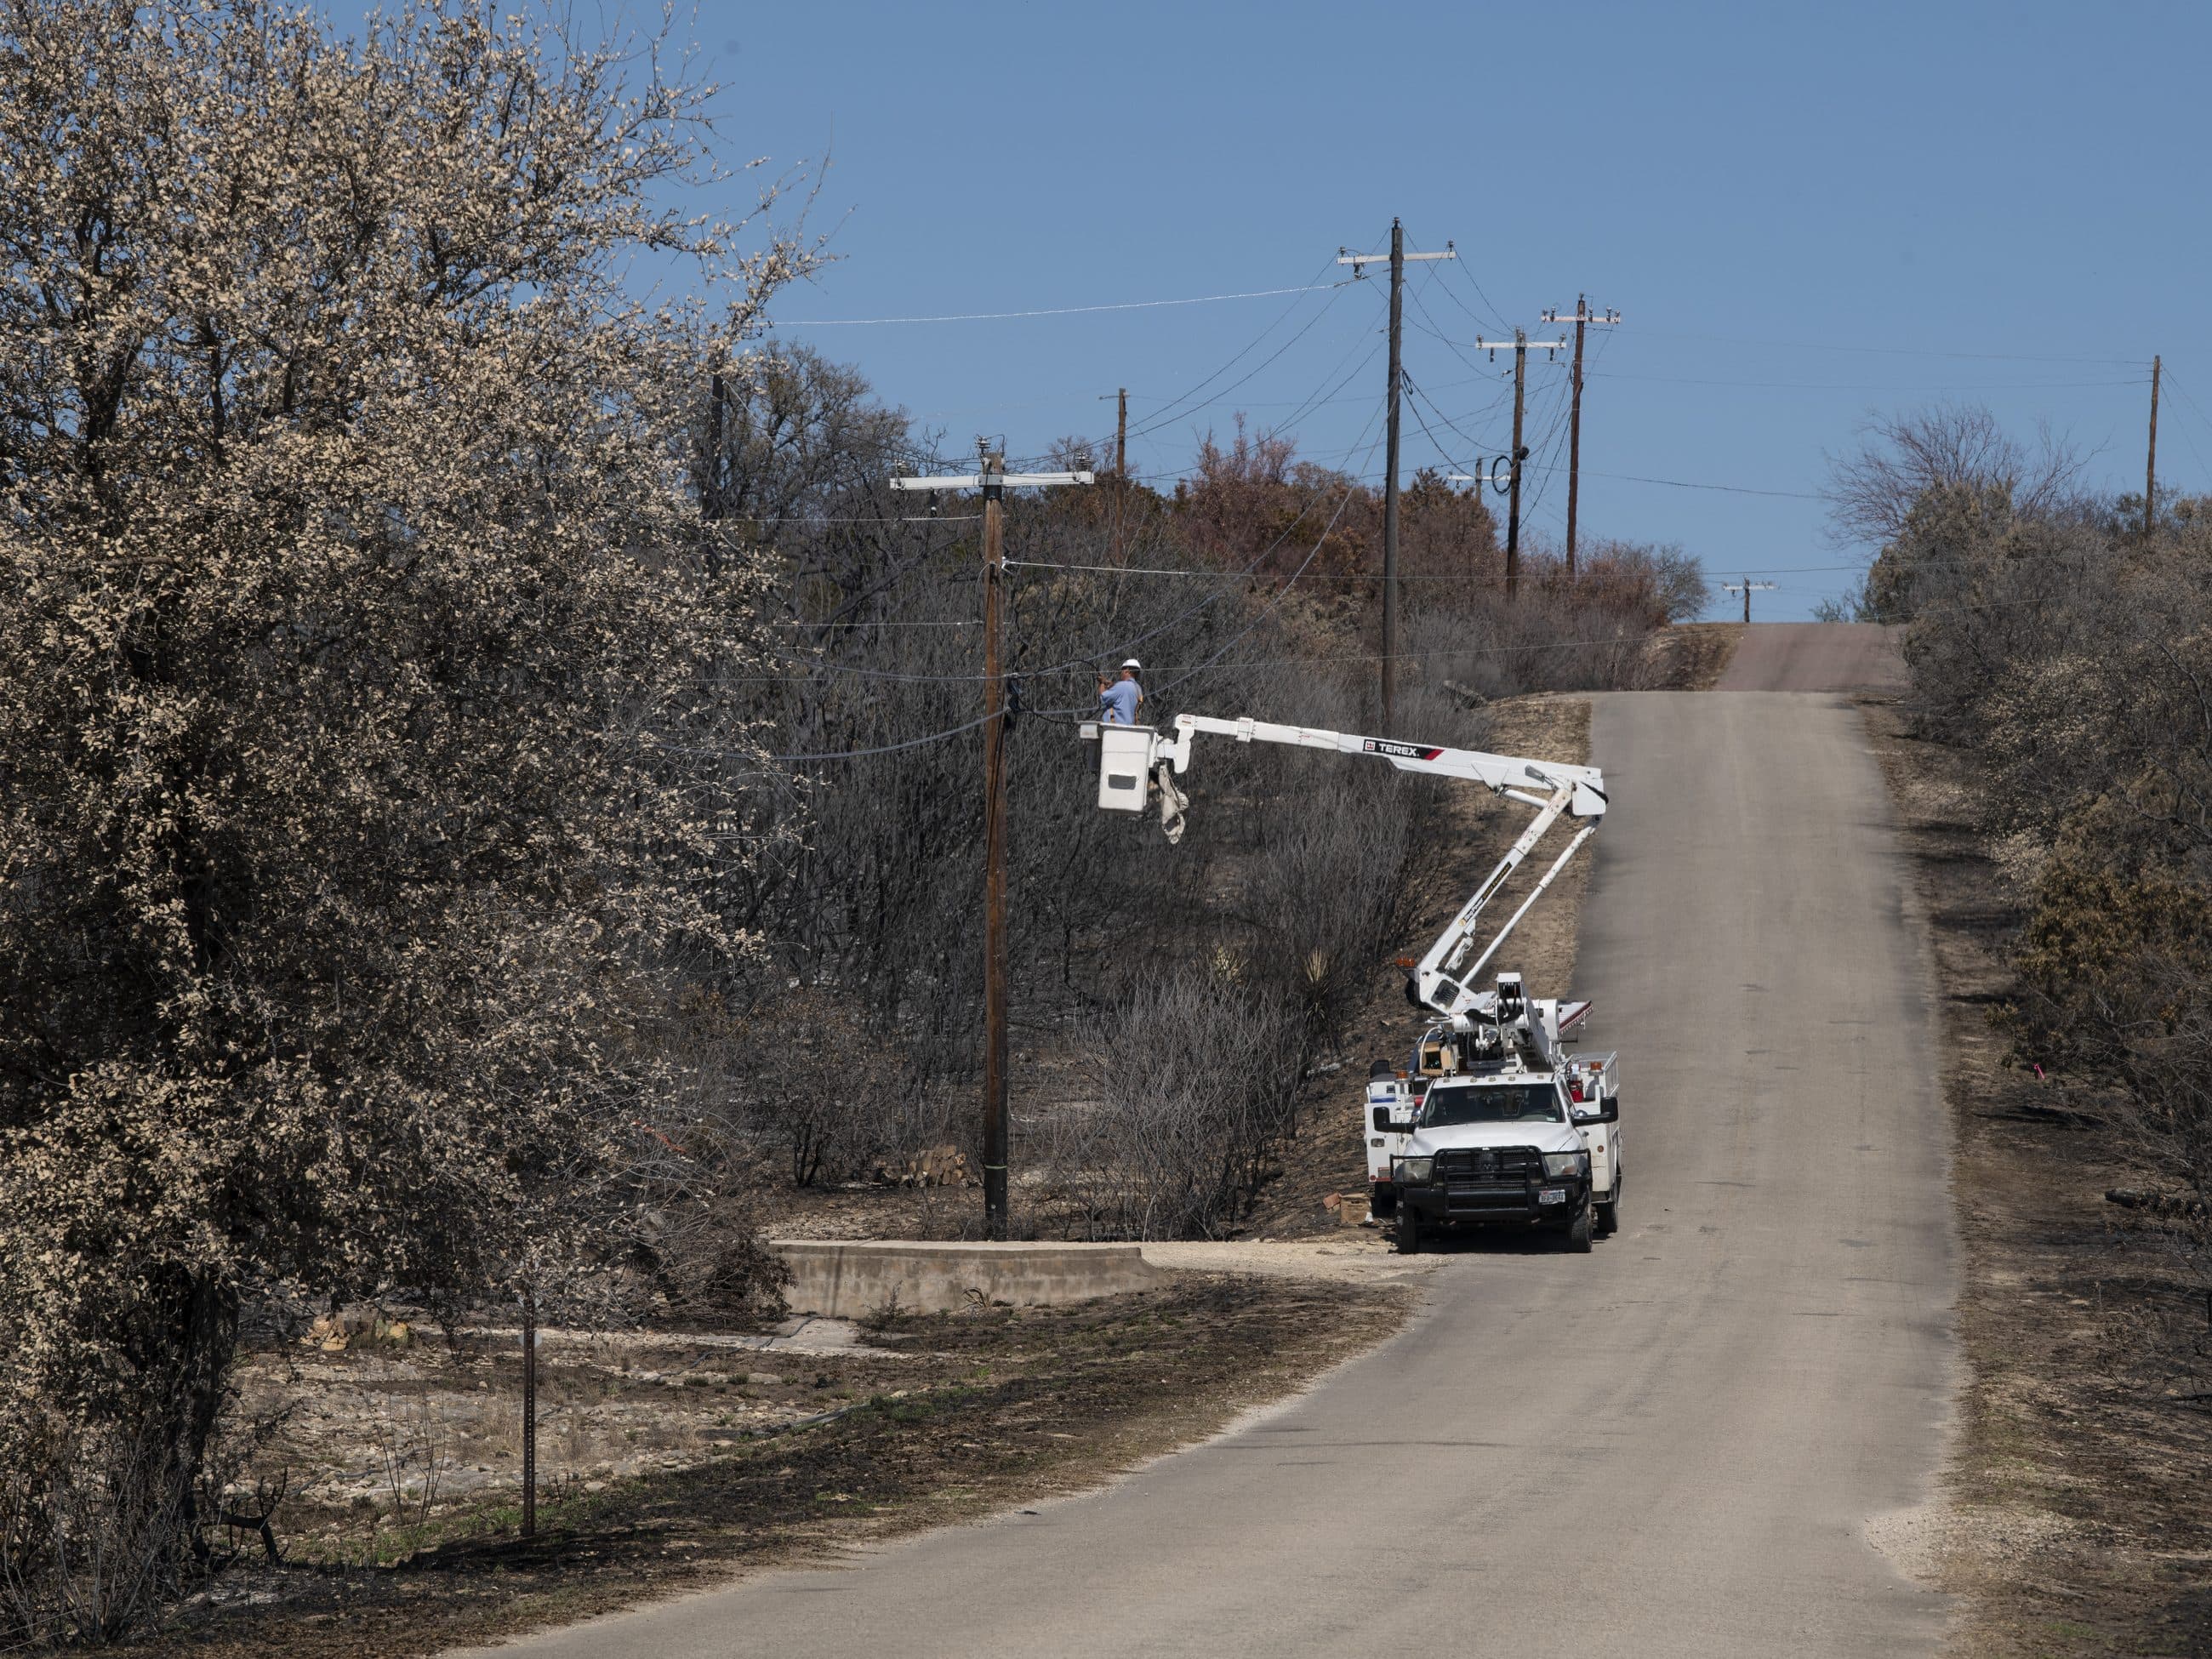
Line-segment risk analysis from ignition, built to advise operational decisions like Public Safety Power Shutoffs (PSPS).
Thousands of fires modeled along your infrastructure, capturing the risk of a major spread event.
Nearby values are incorporated to quantify liability and values at risk.
Integrates seamlessly with any format of GIS data or custom infrastructure.
Toggleable thresholds meet the needs of in-house situational procedures and alerts.
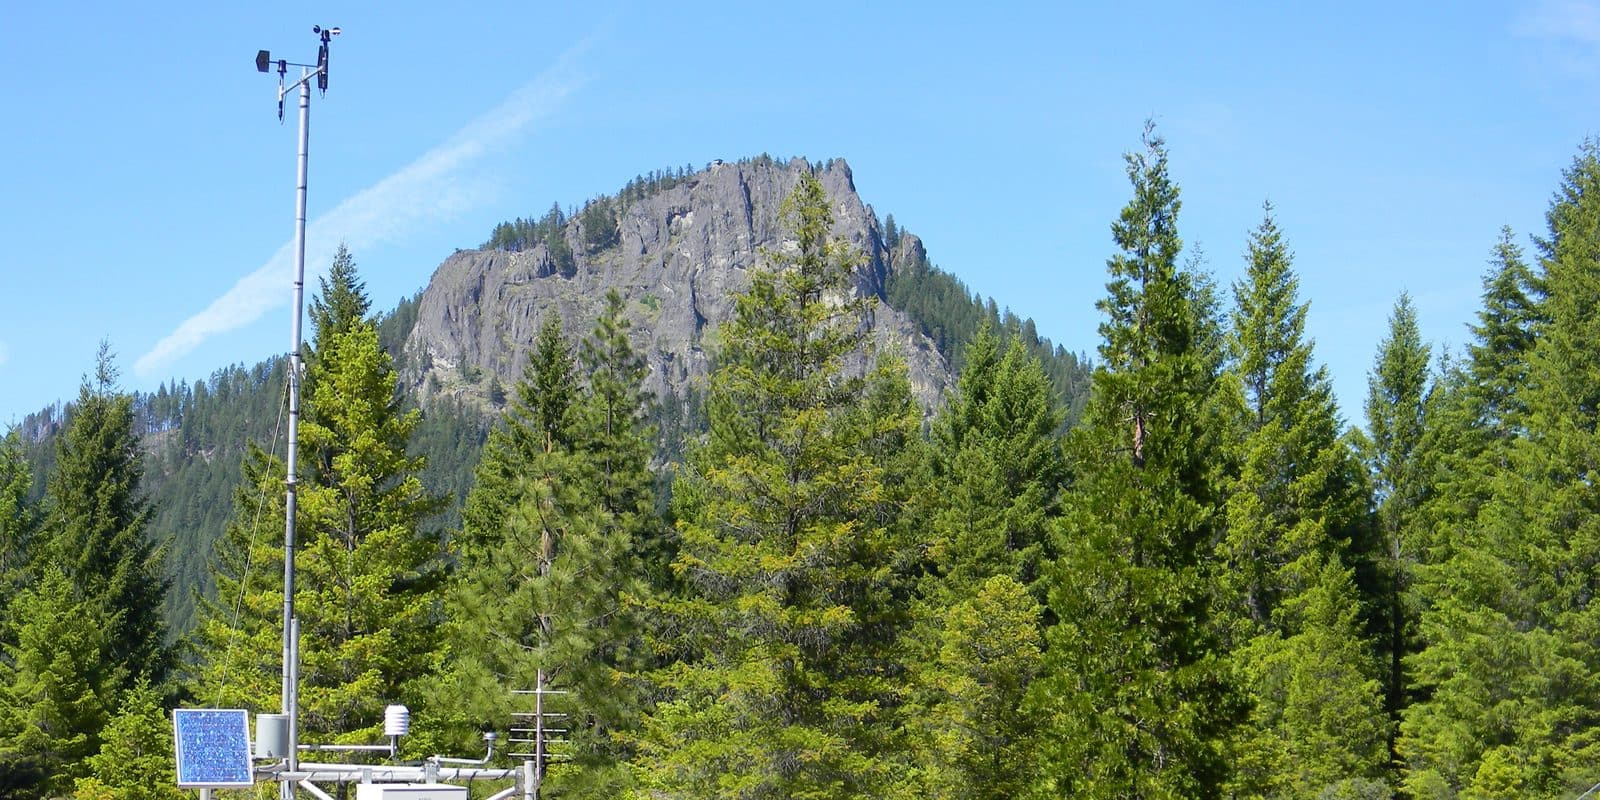
Historical model analysis recommends fuel management areas based on historical weather trends and current fuel status.
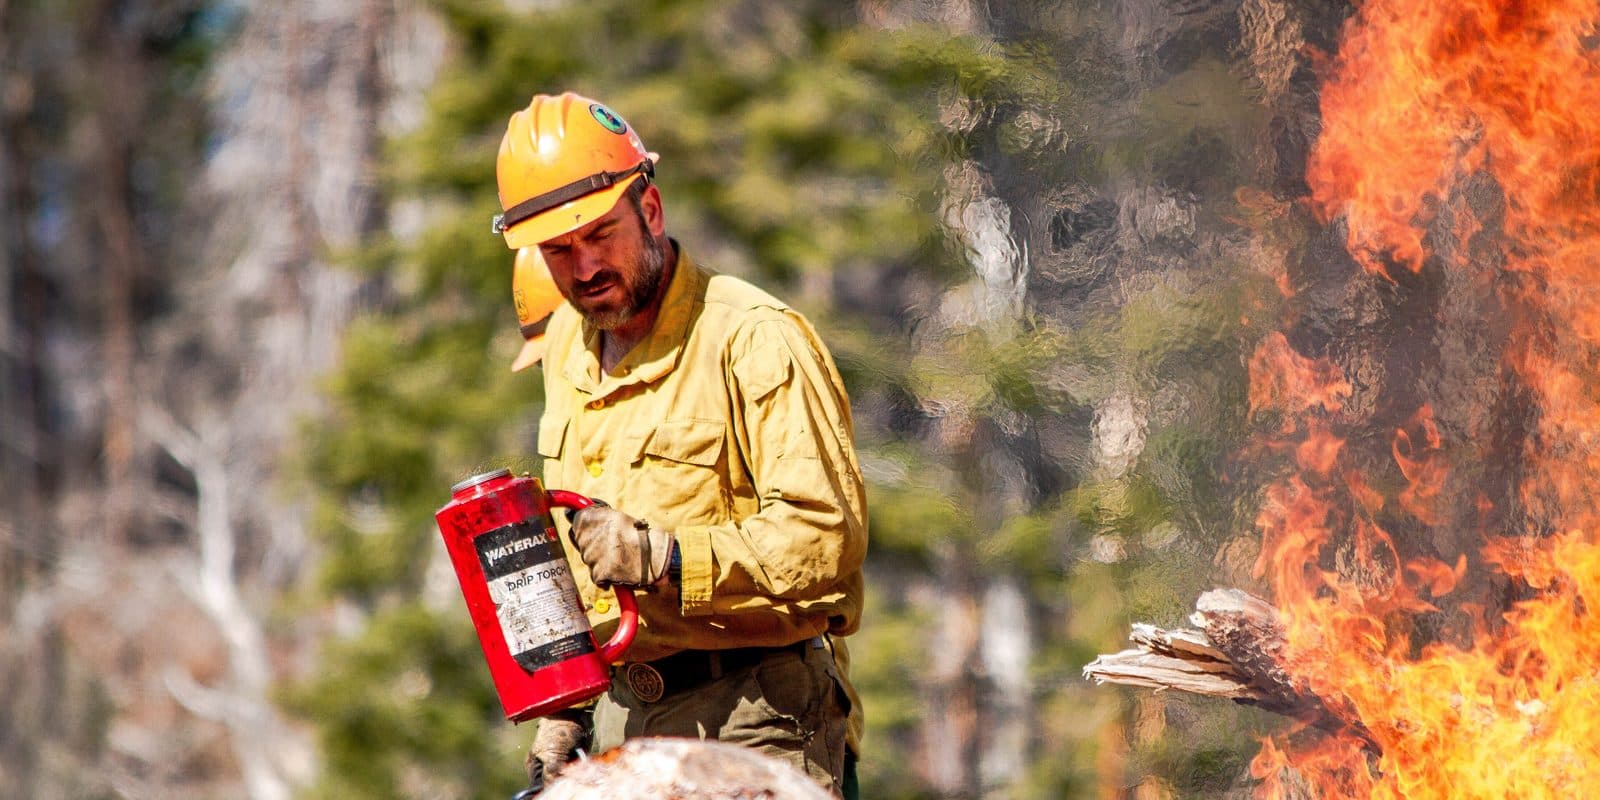
Simplified from morning status updates down to deep dives into critical scenarios.
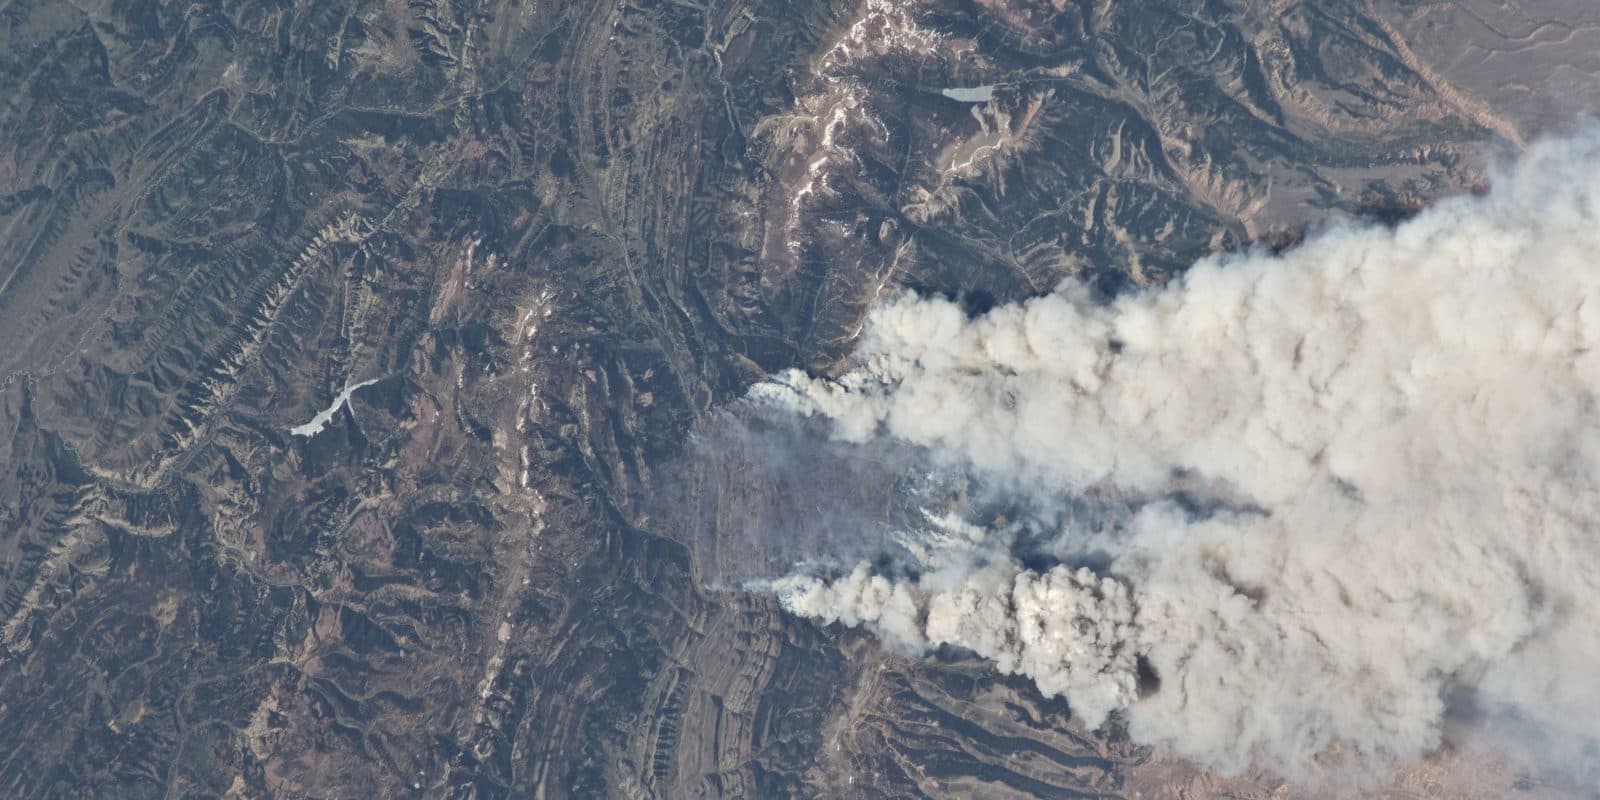
The score stays the same instrument all day. What changes is what the day asks of it, from the first report to a documented call.
Every segment carries a current score, banded into tiers that map to operational posture. The day starts from one shared picture.
Scores refresh as the forecast changes, and exposure clusters on the map show which miles are driving the risk.
A segment moves into a band your procedures flagged. The alert goes out under rules your organization set.
If the answer is a Public Safety Power Shutoff, the case is already assembled: the segments, the modeled fires behind their scores, and the structures those fires reach.
A walkthrough of the morning report, segment scores, and thresholds, scheduled with qualified teams during evaluation.