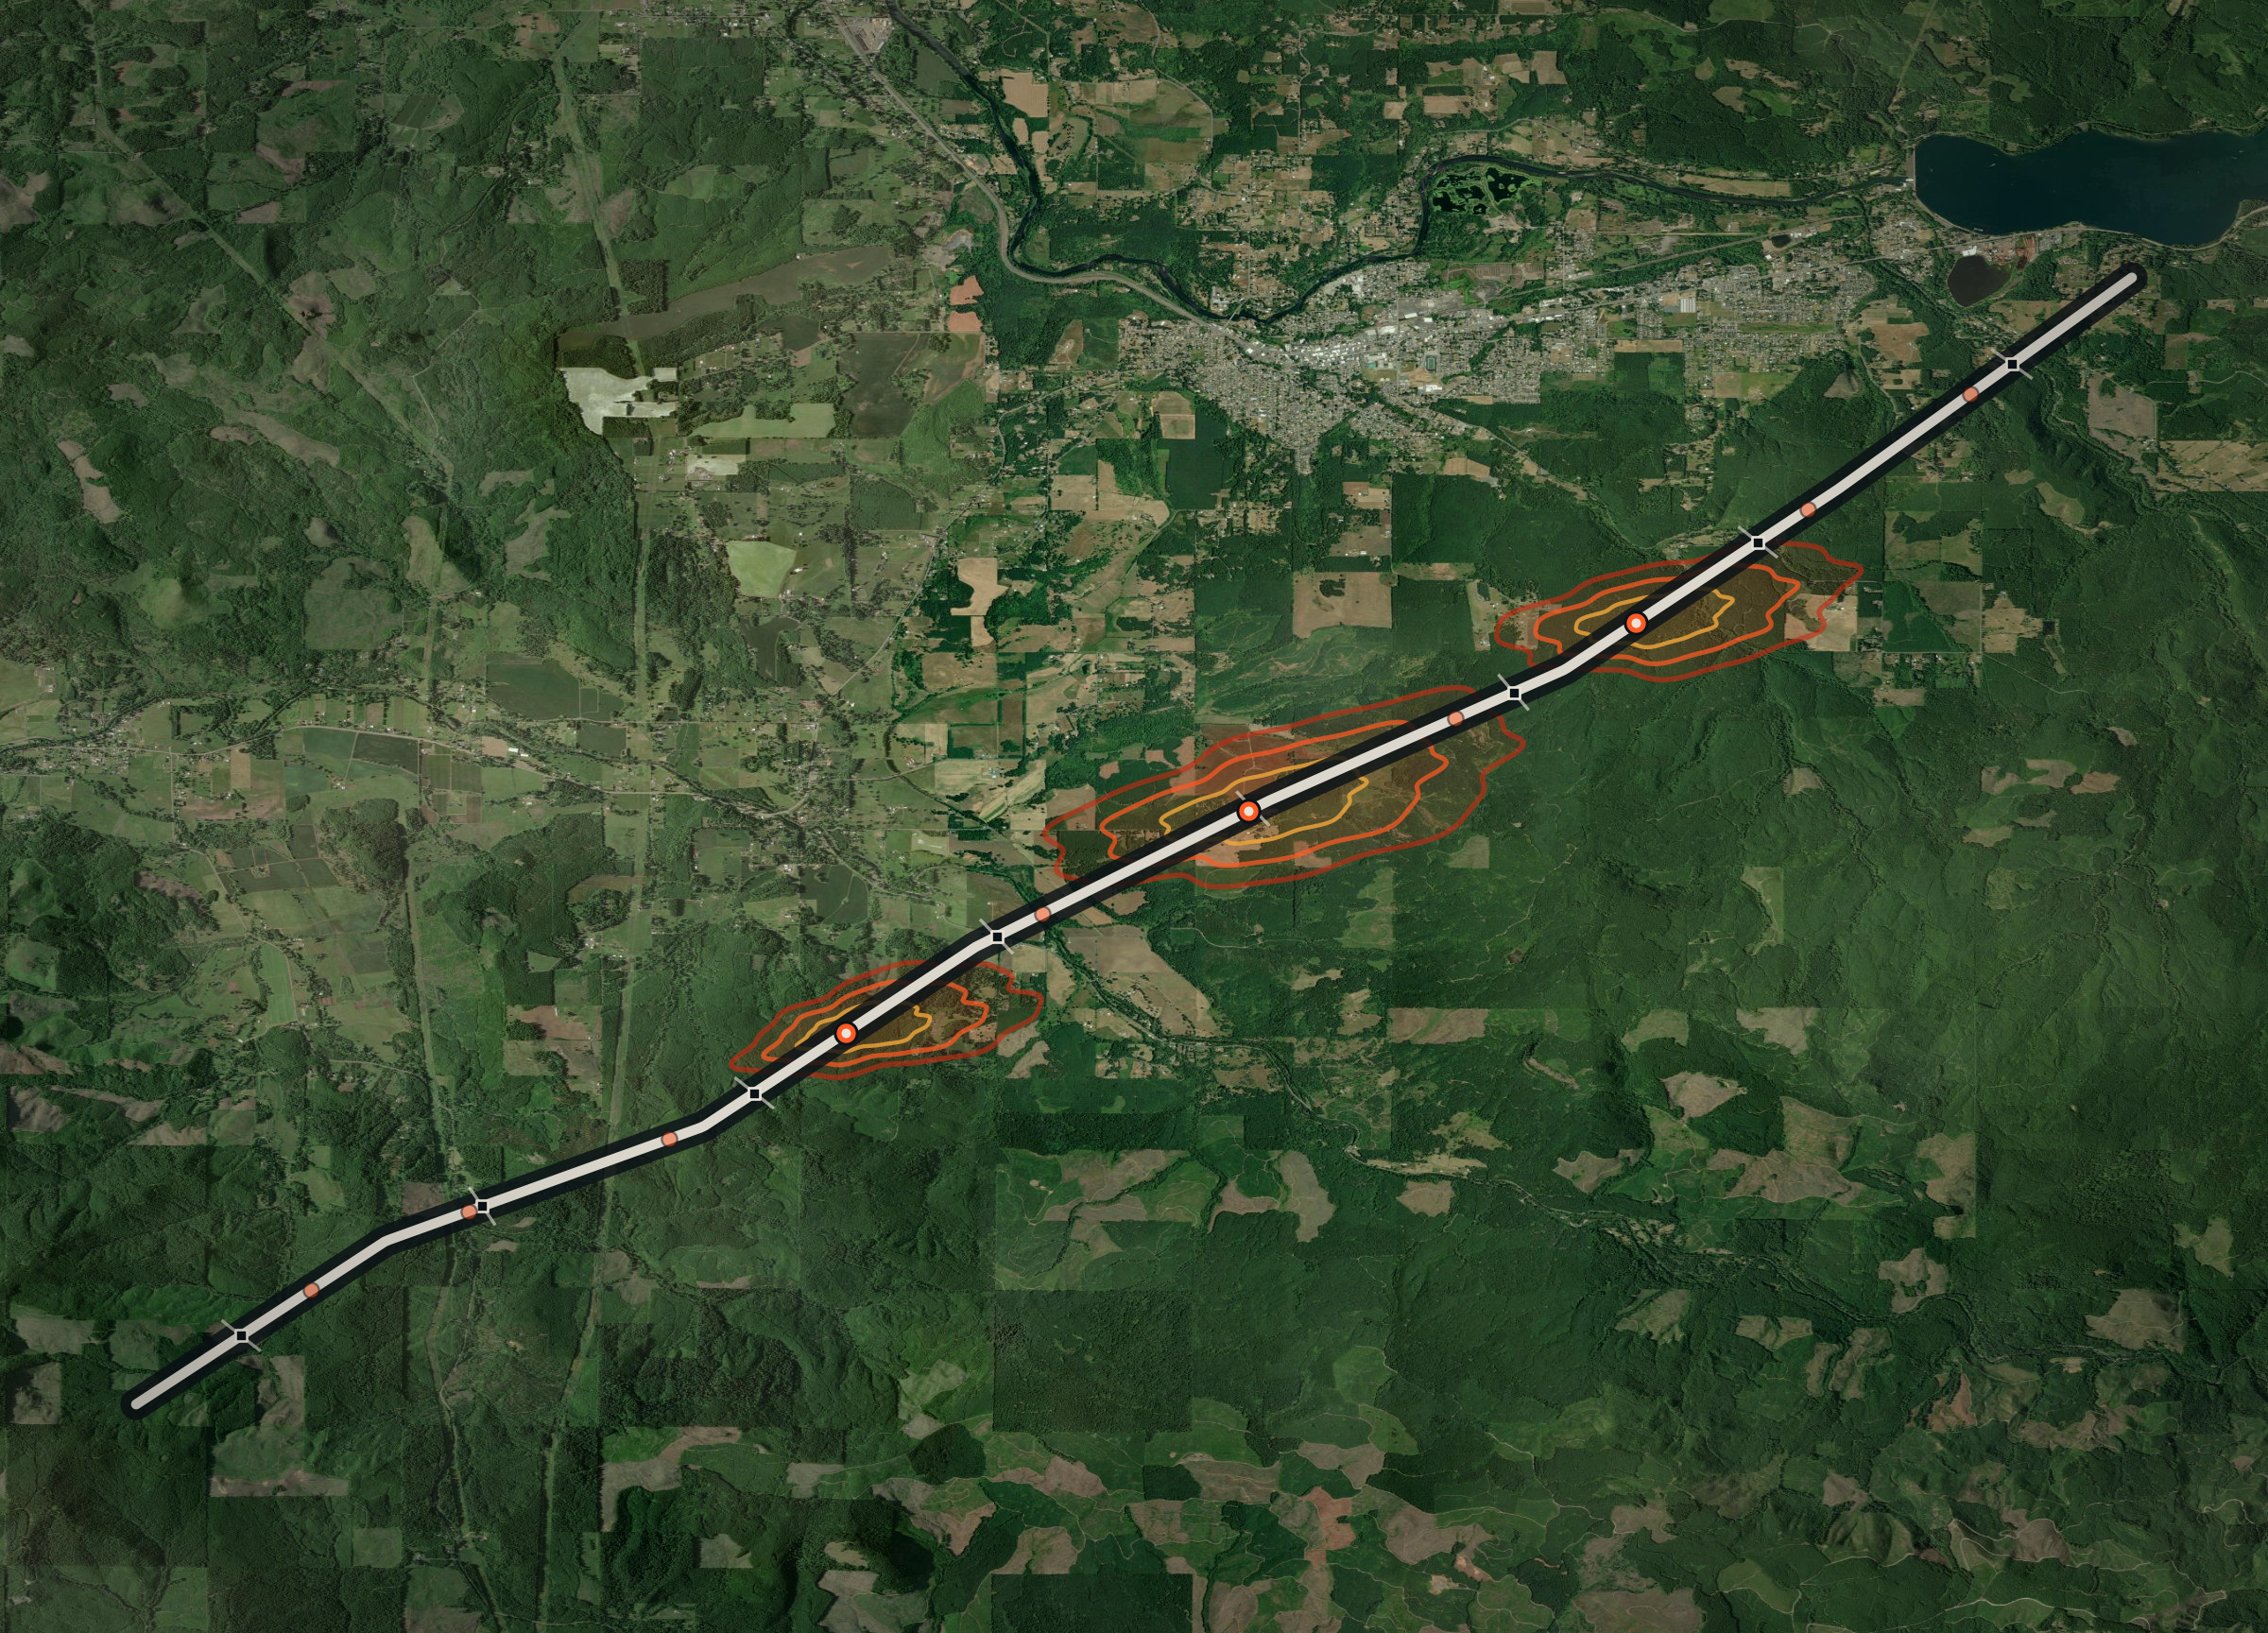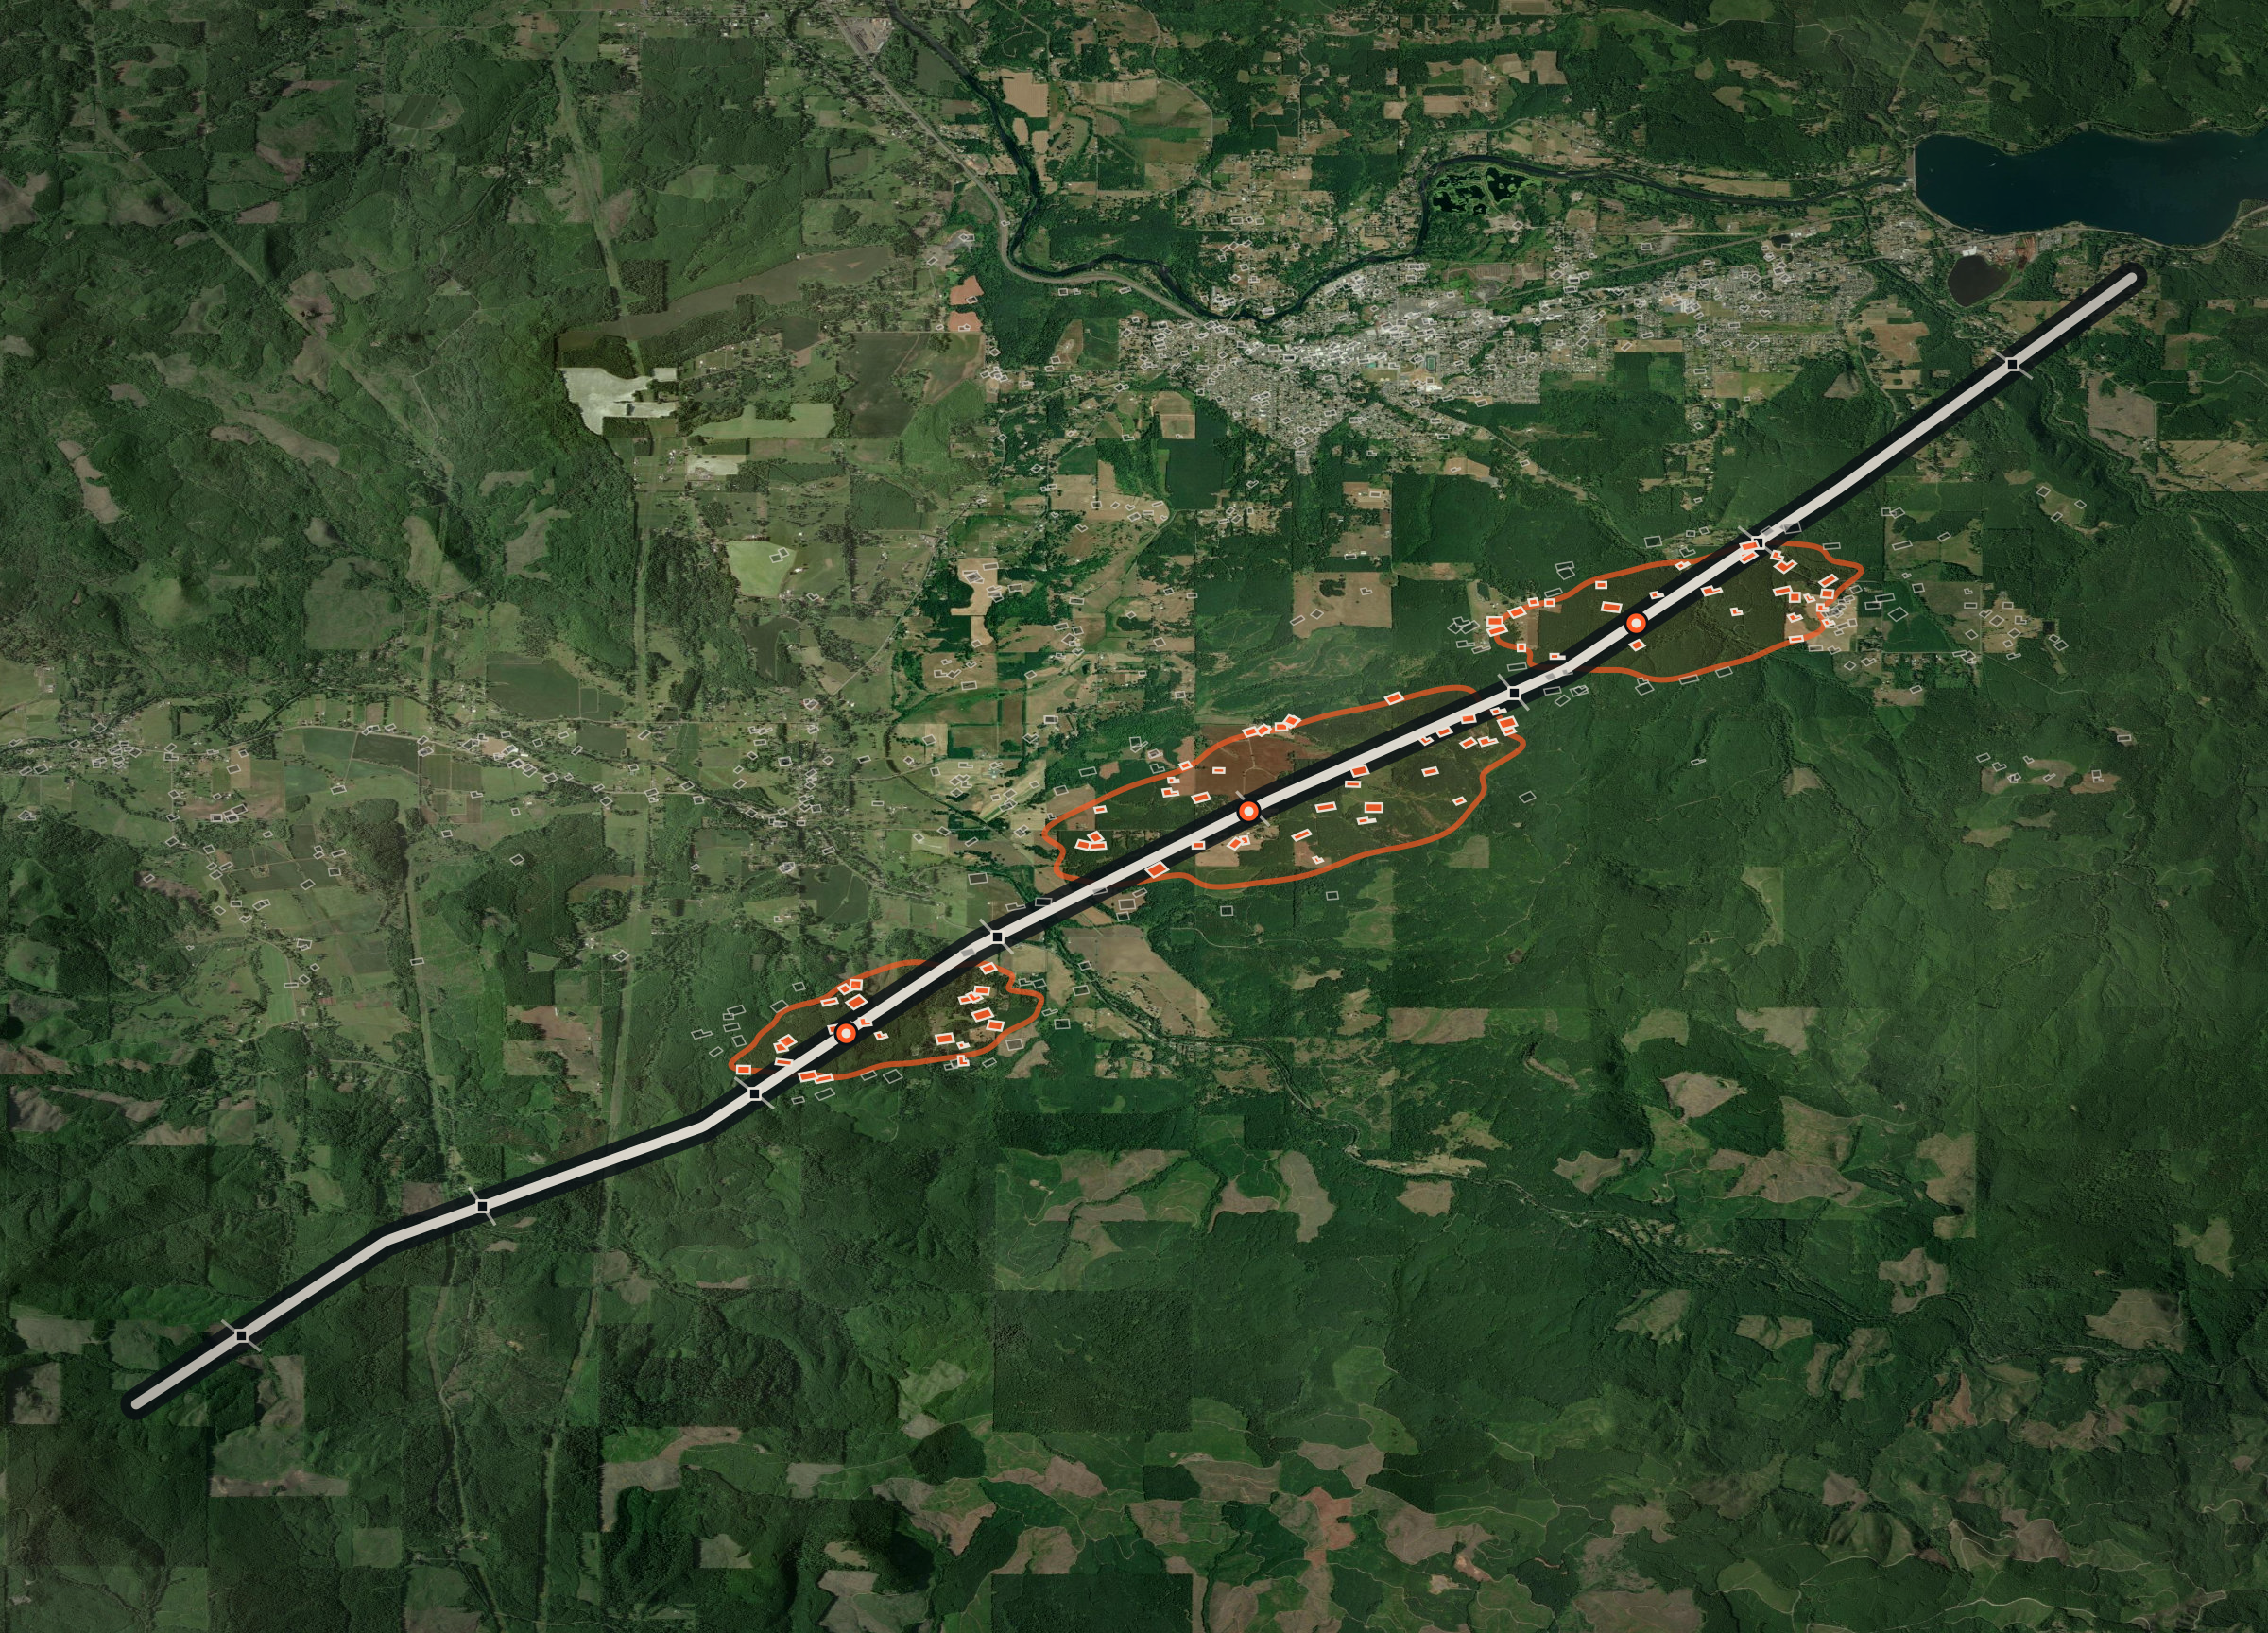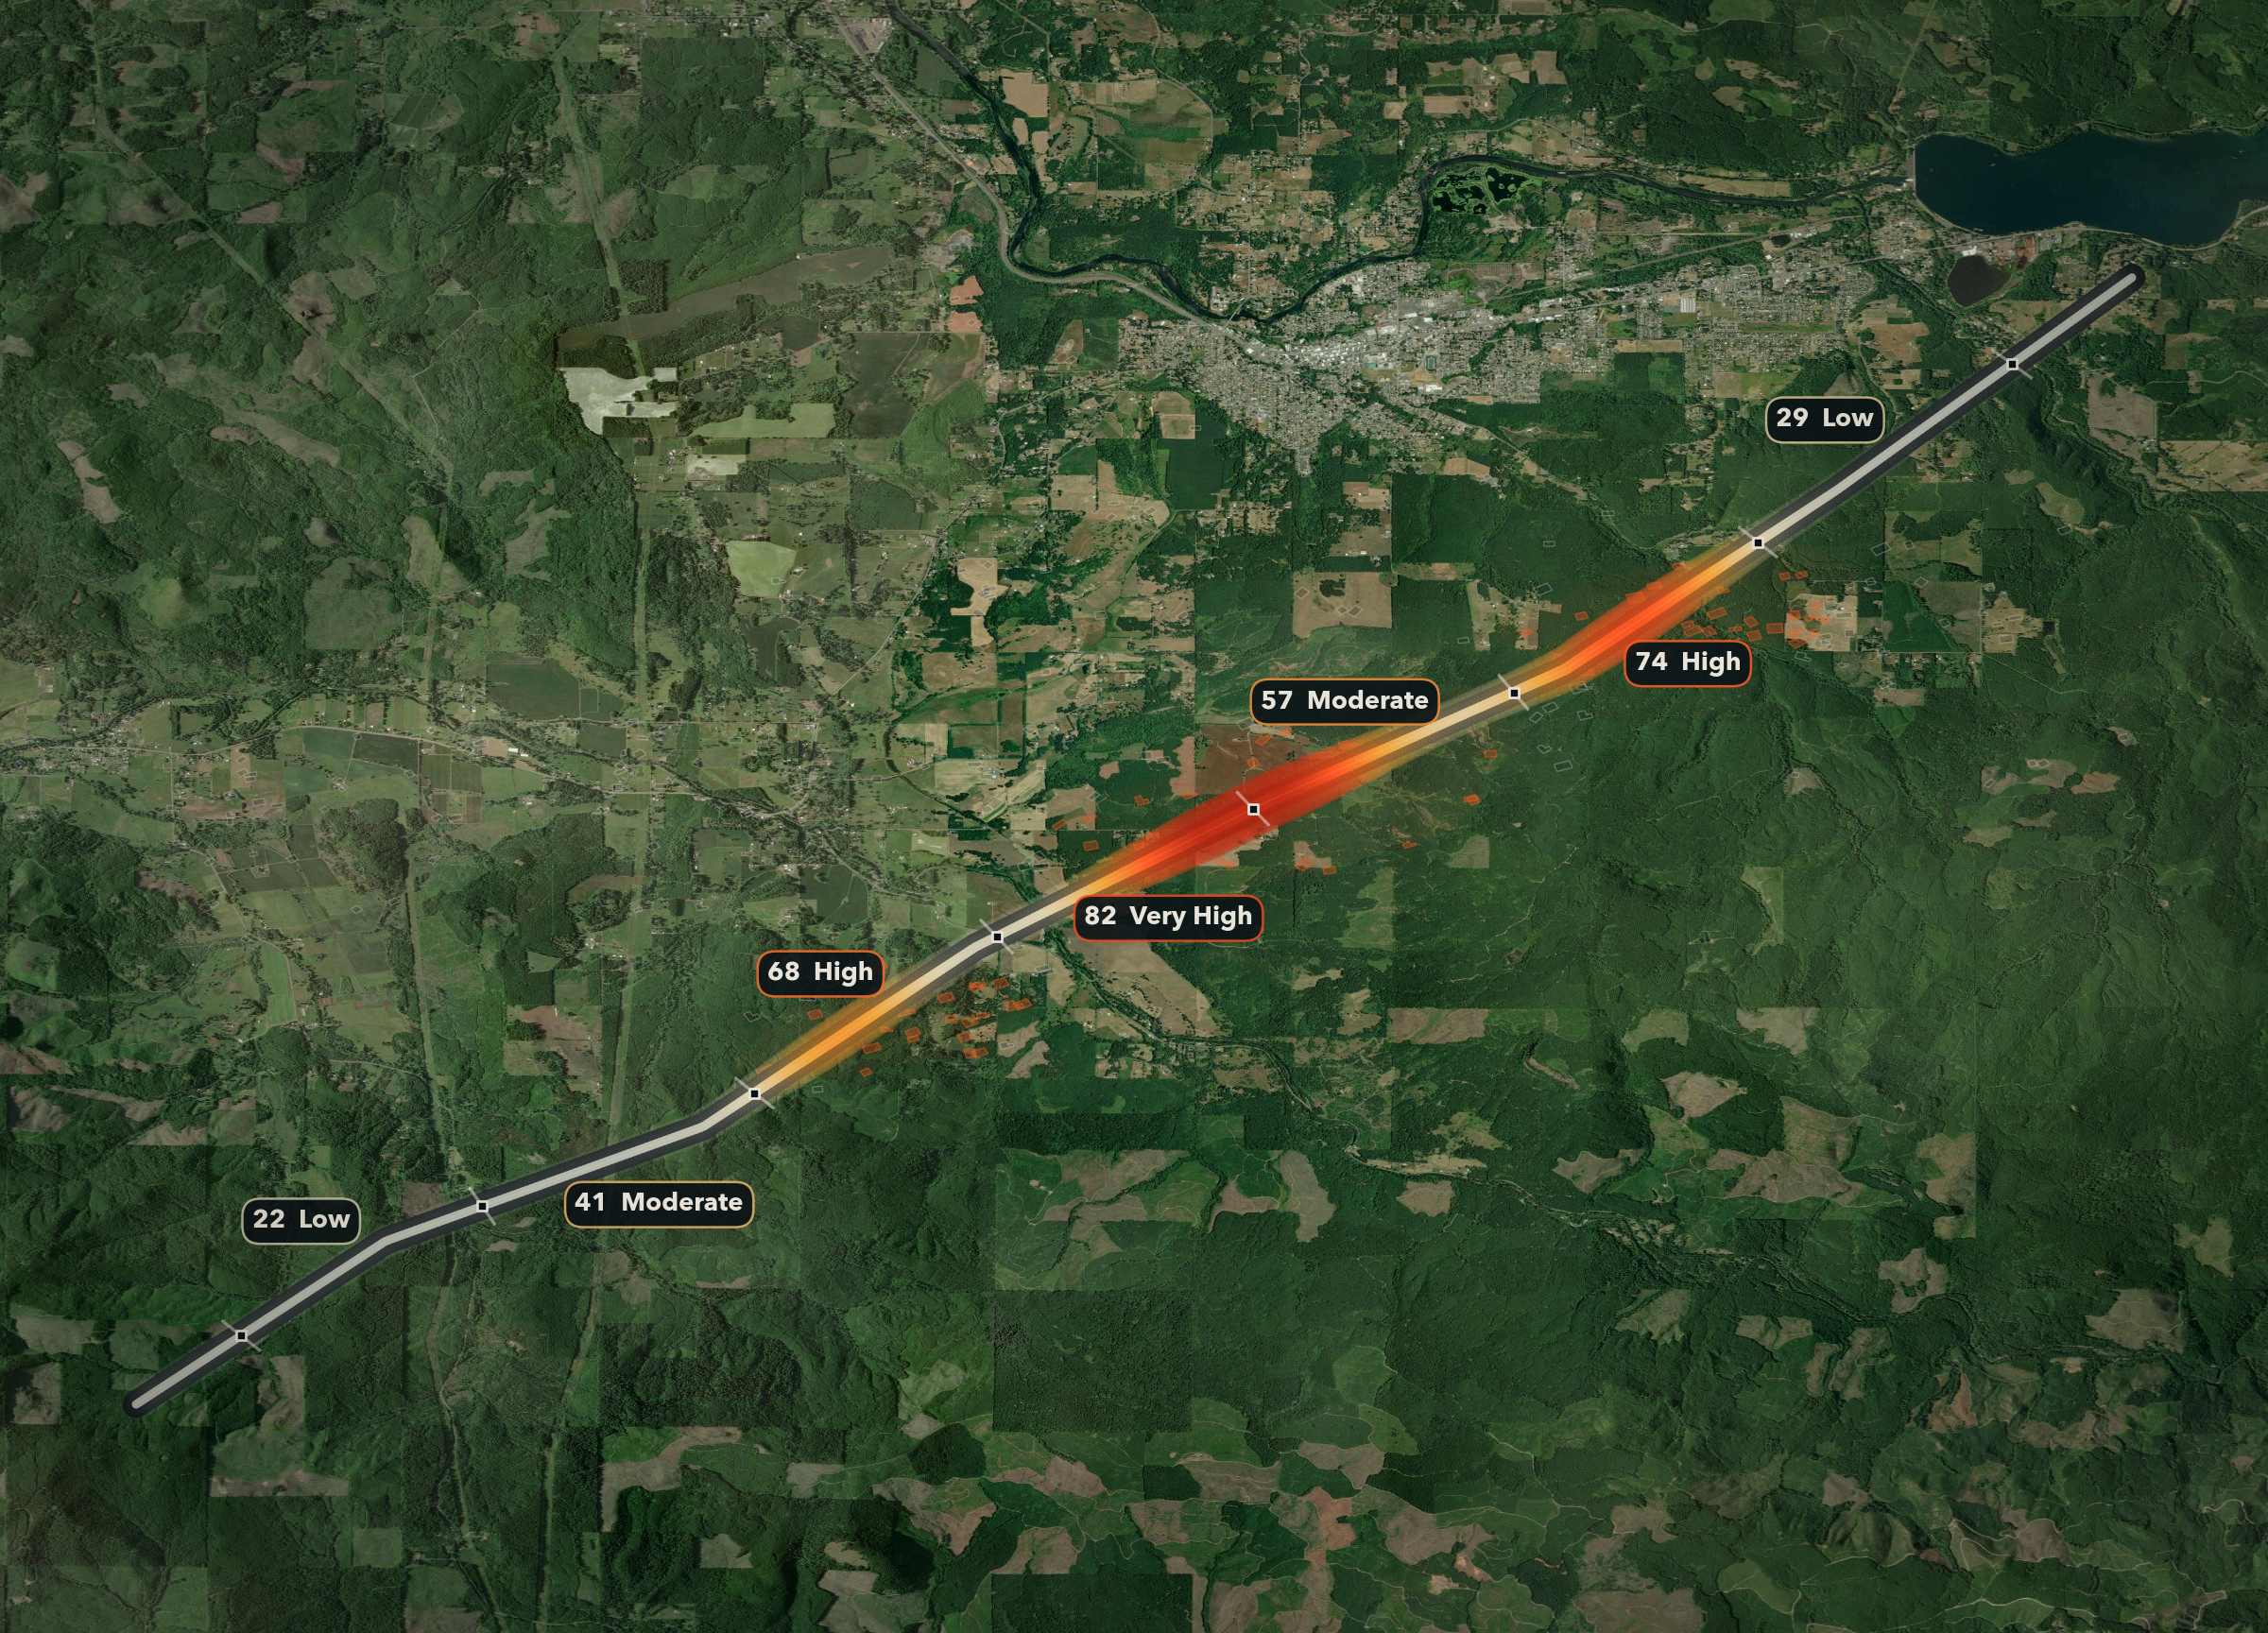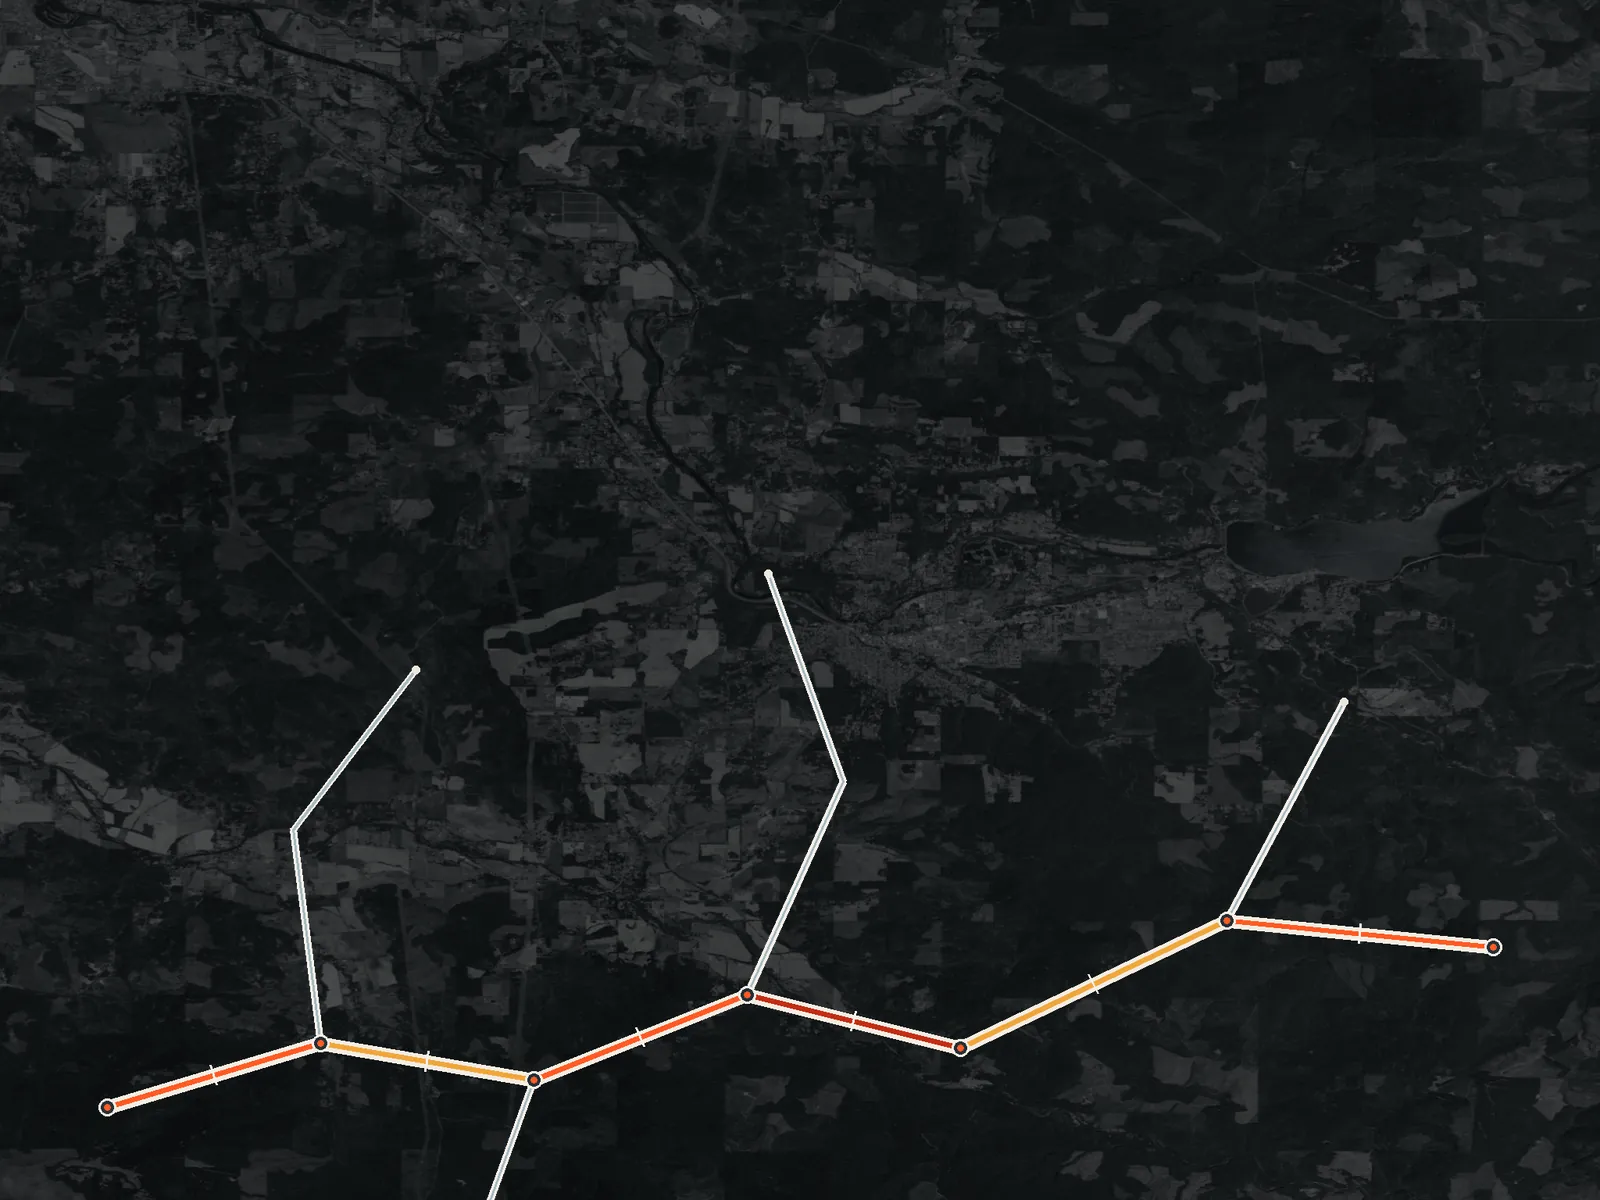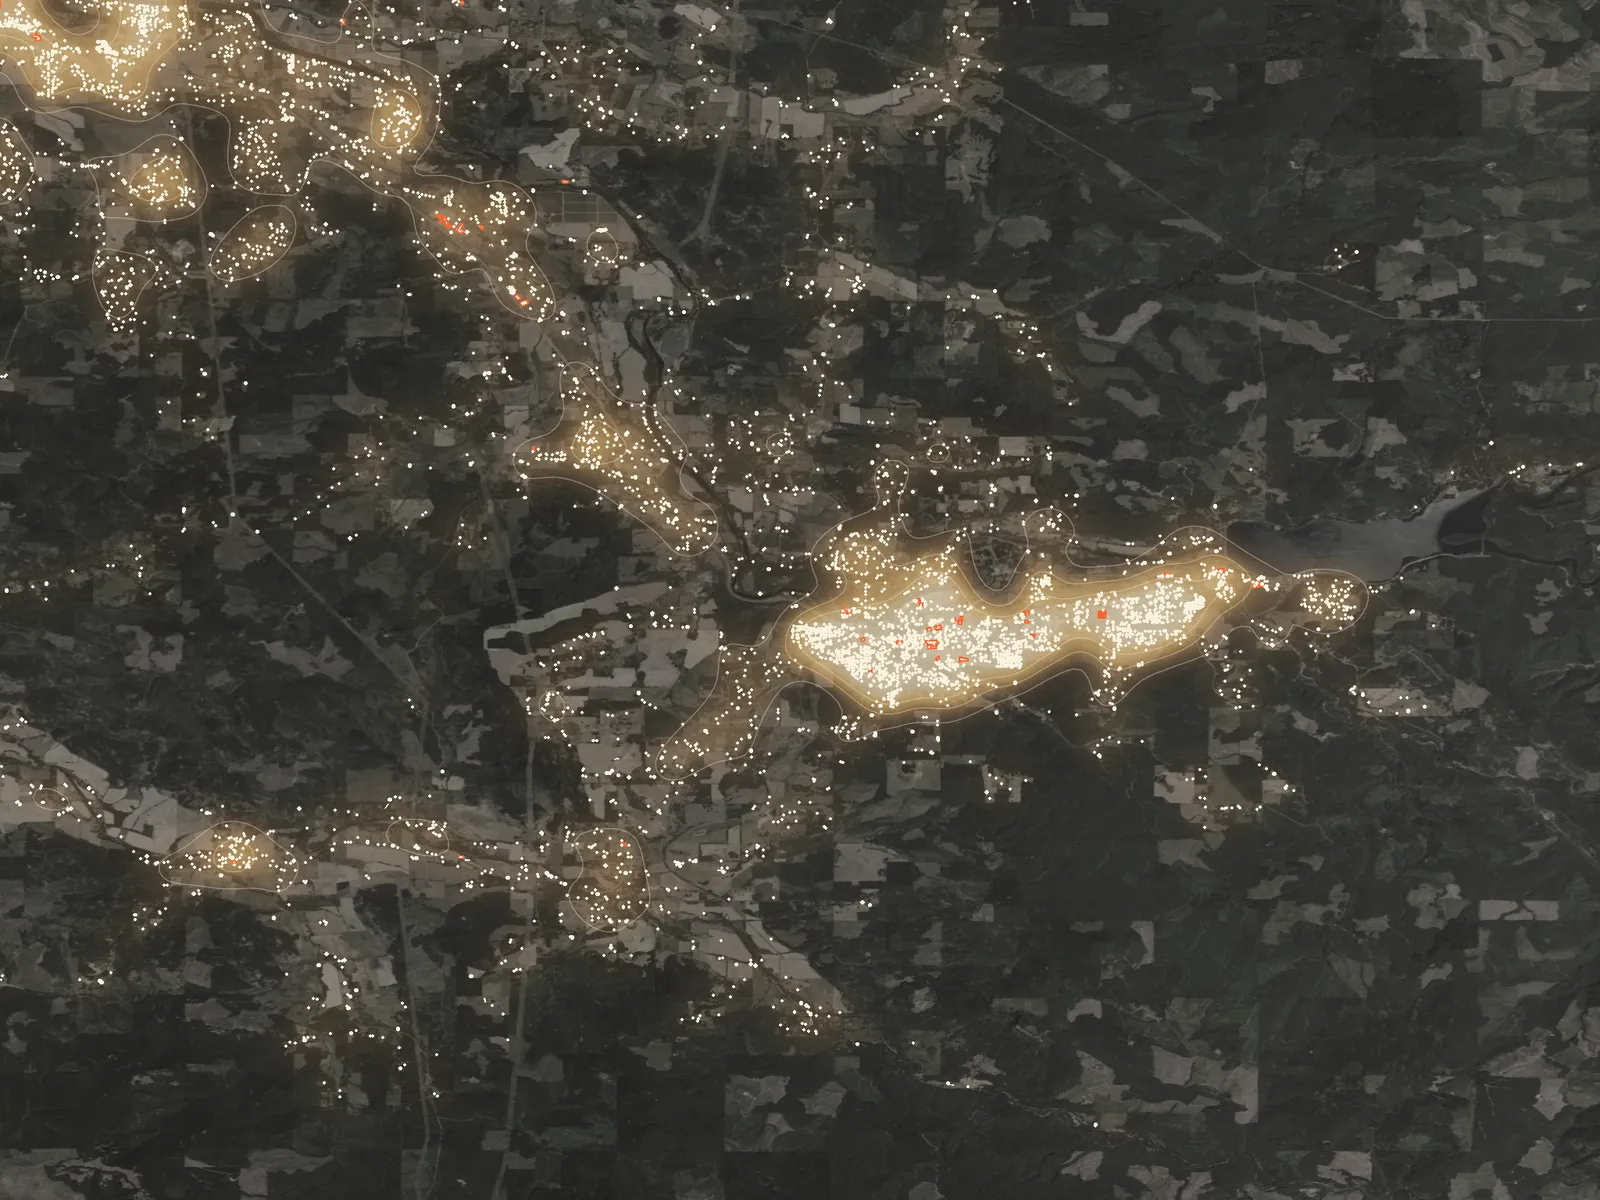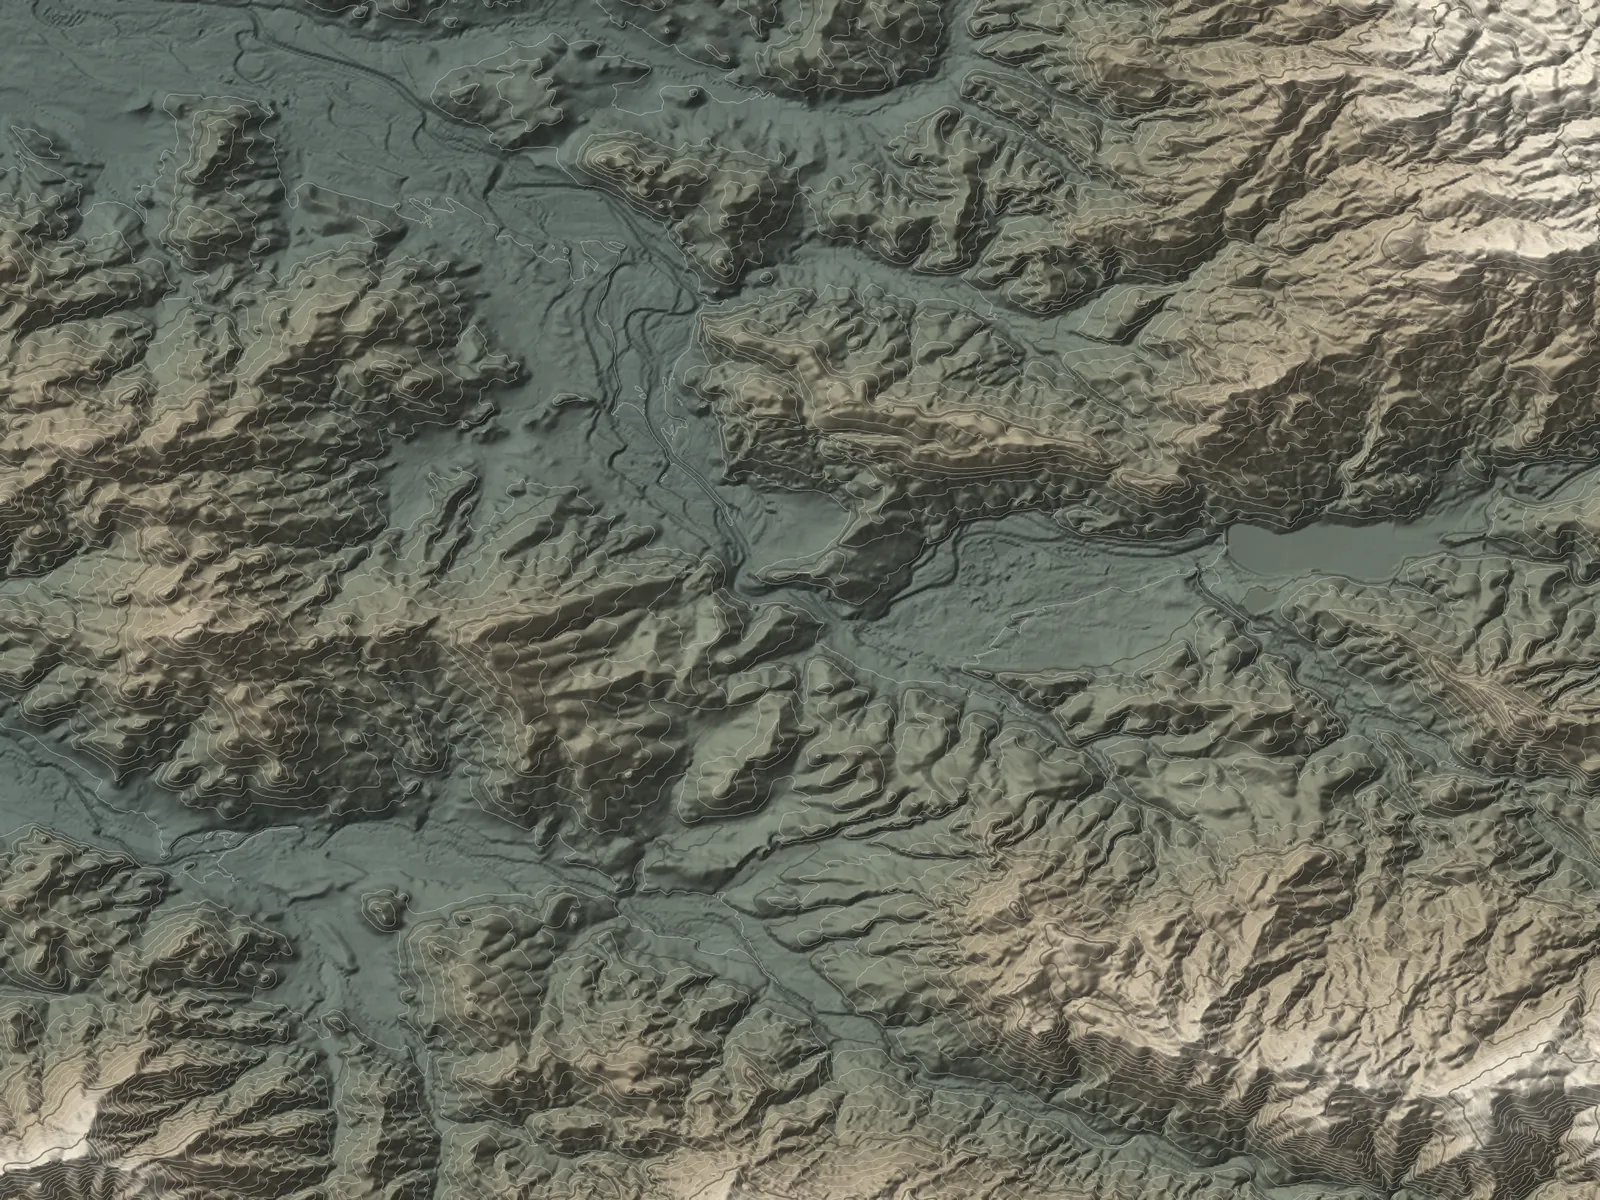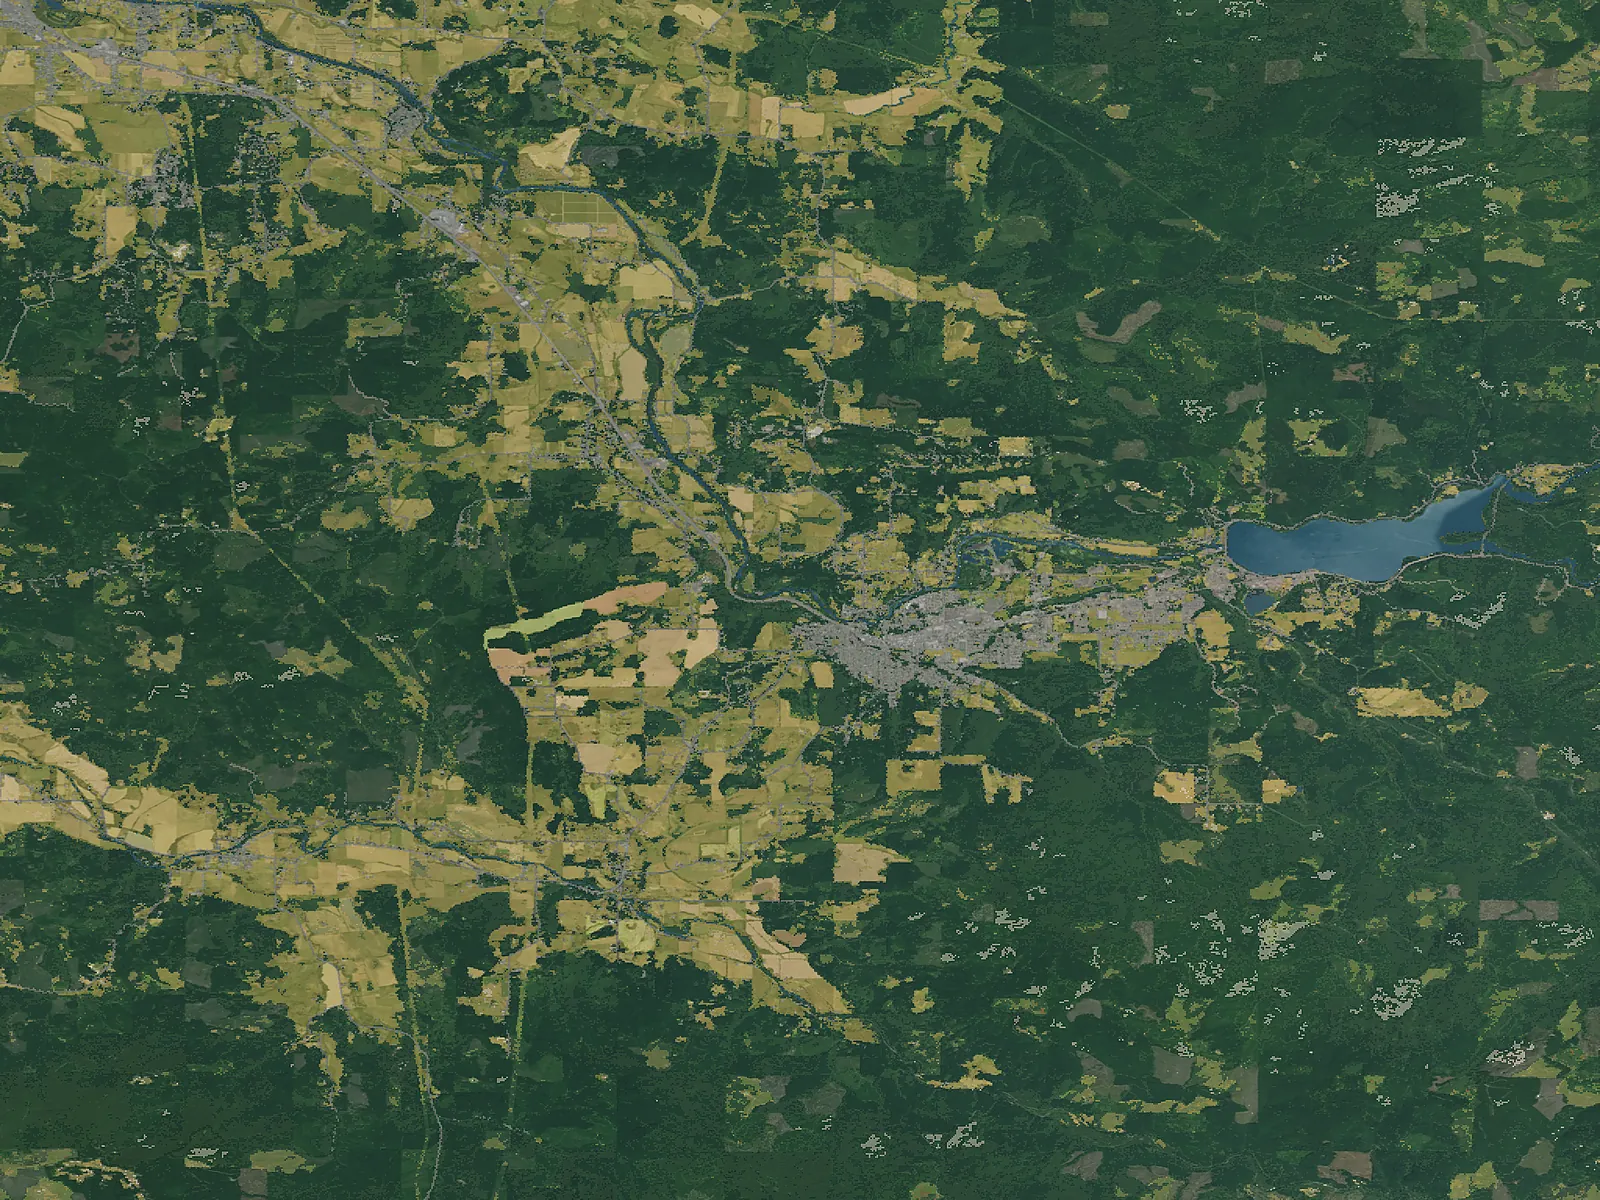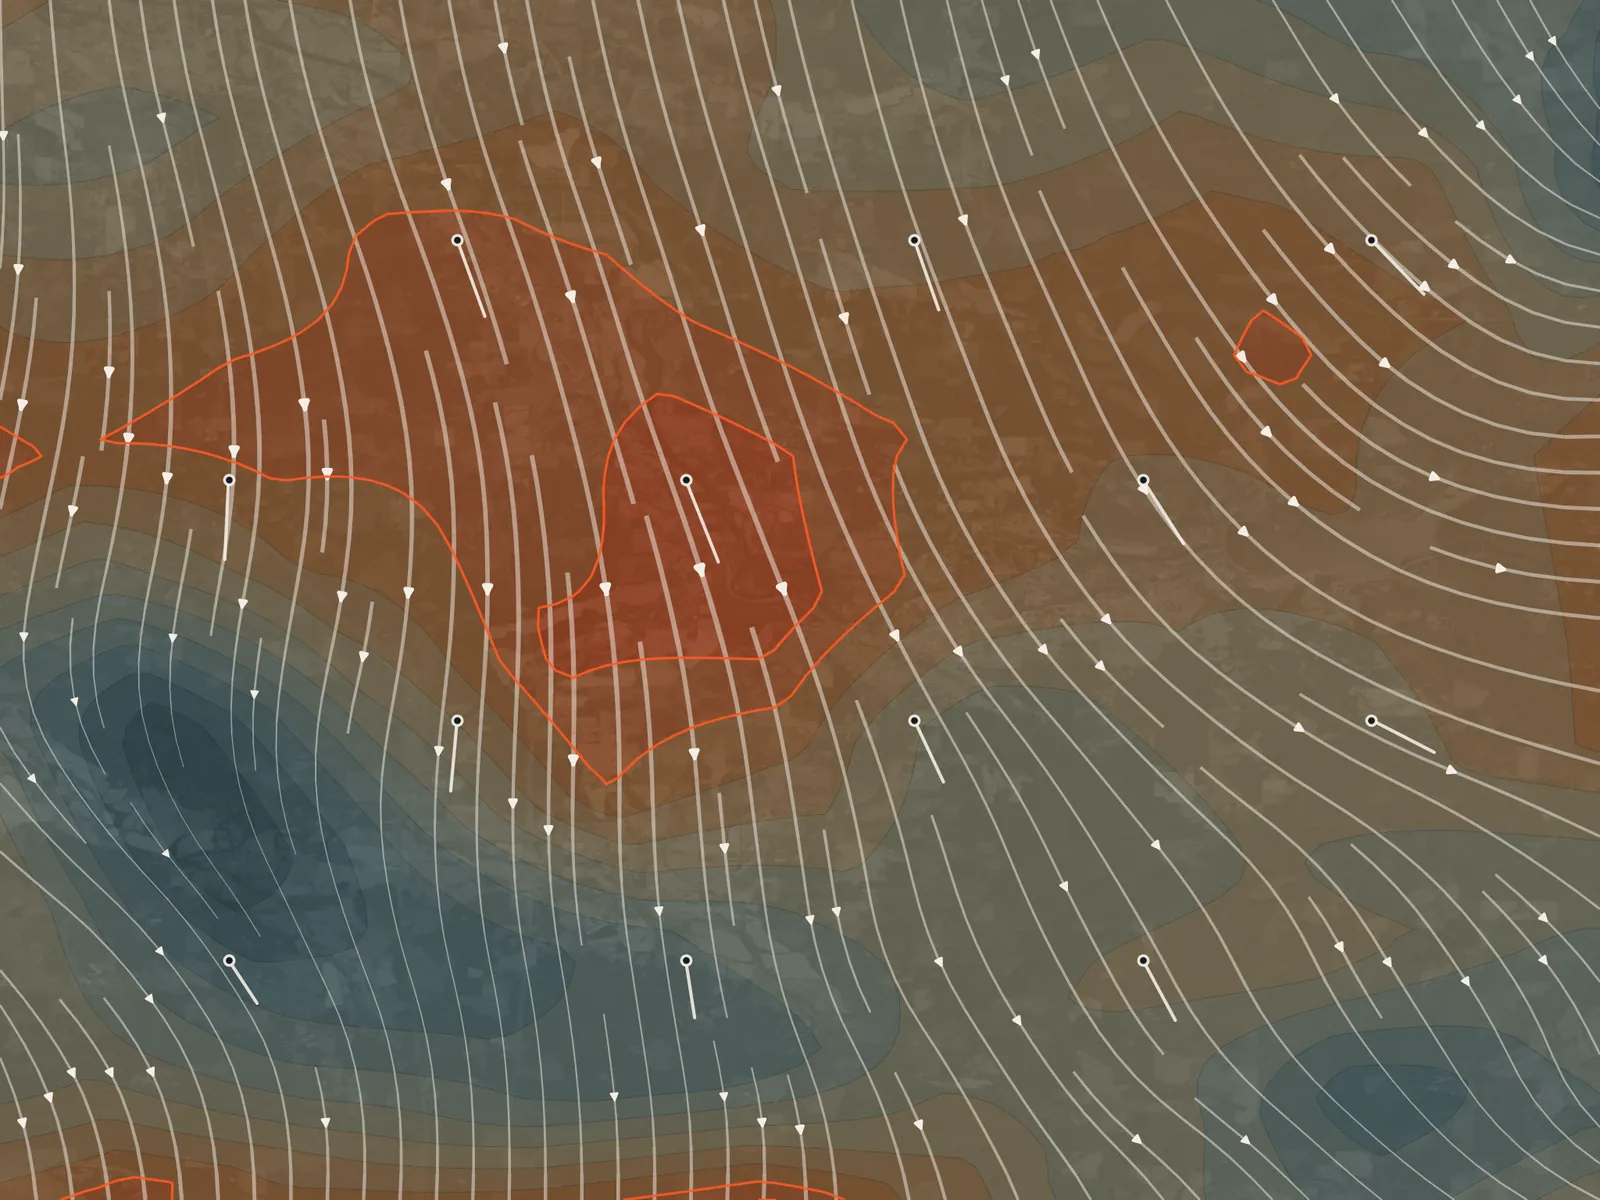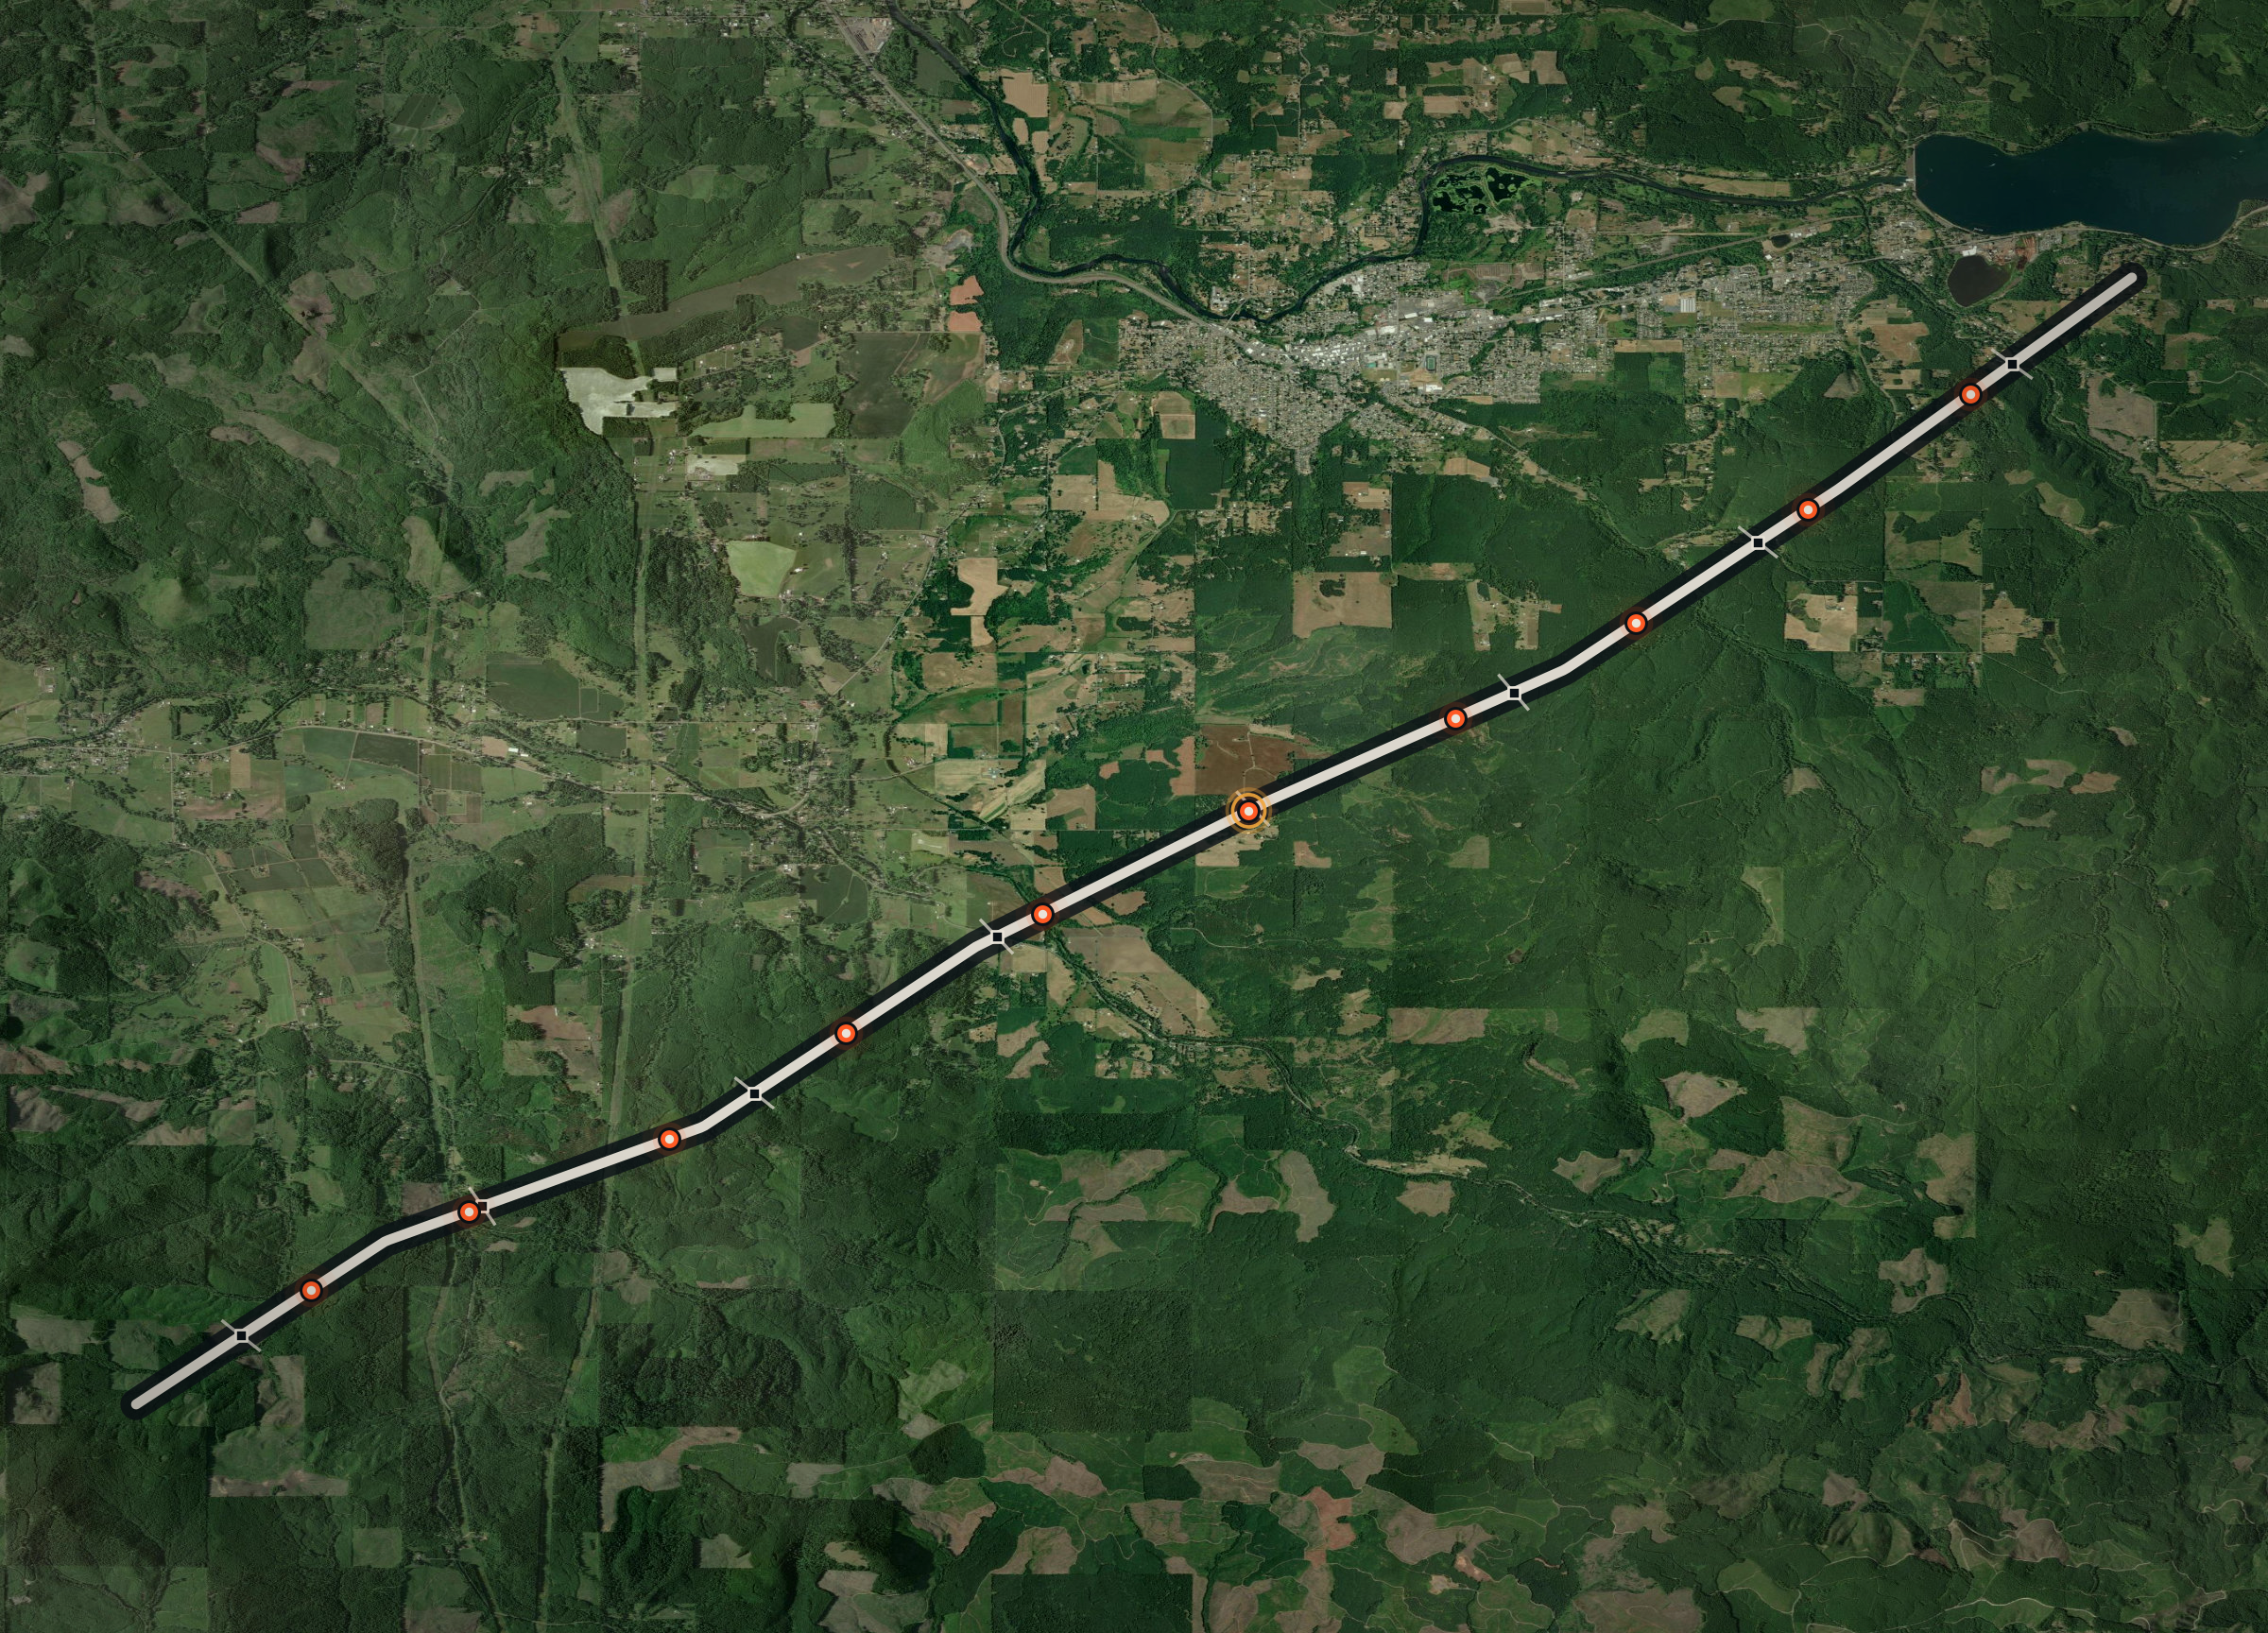
Ignitions are placed at controlled intervals along your infrastructure so every span is tested.
Early Access
Methodology
Thousands of fires are modeled along your infrastructure. Each ignition is spread under historical, current, and forecasted conditions, and the structures it reaches are counted toward the segments that produced it.
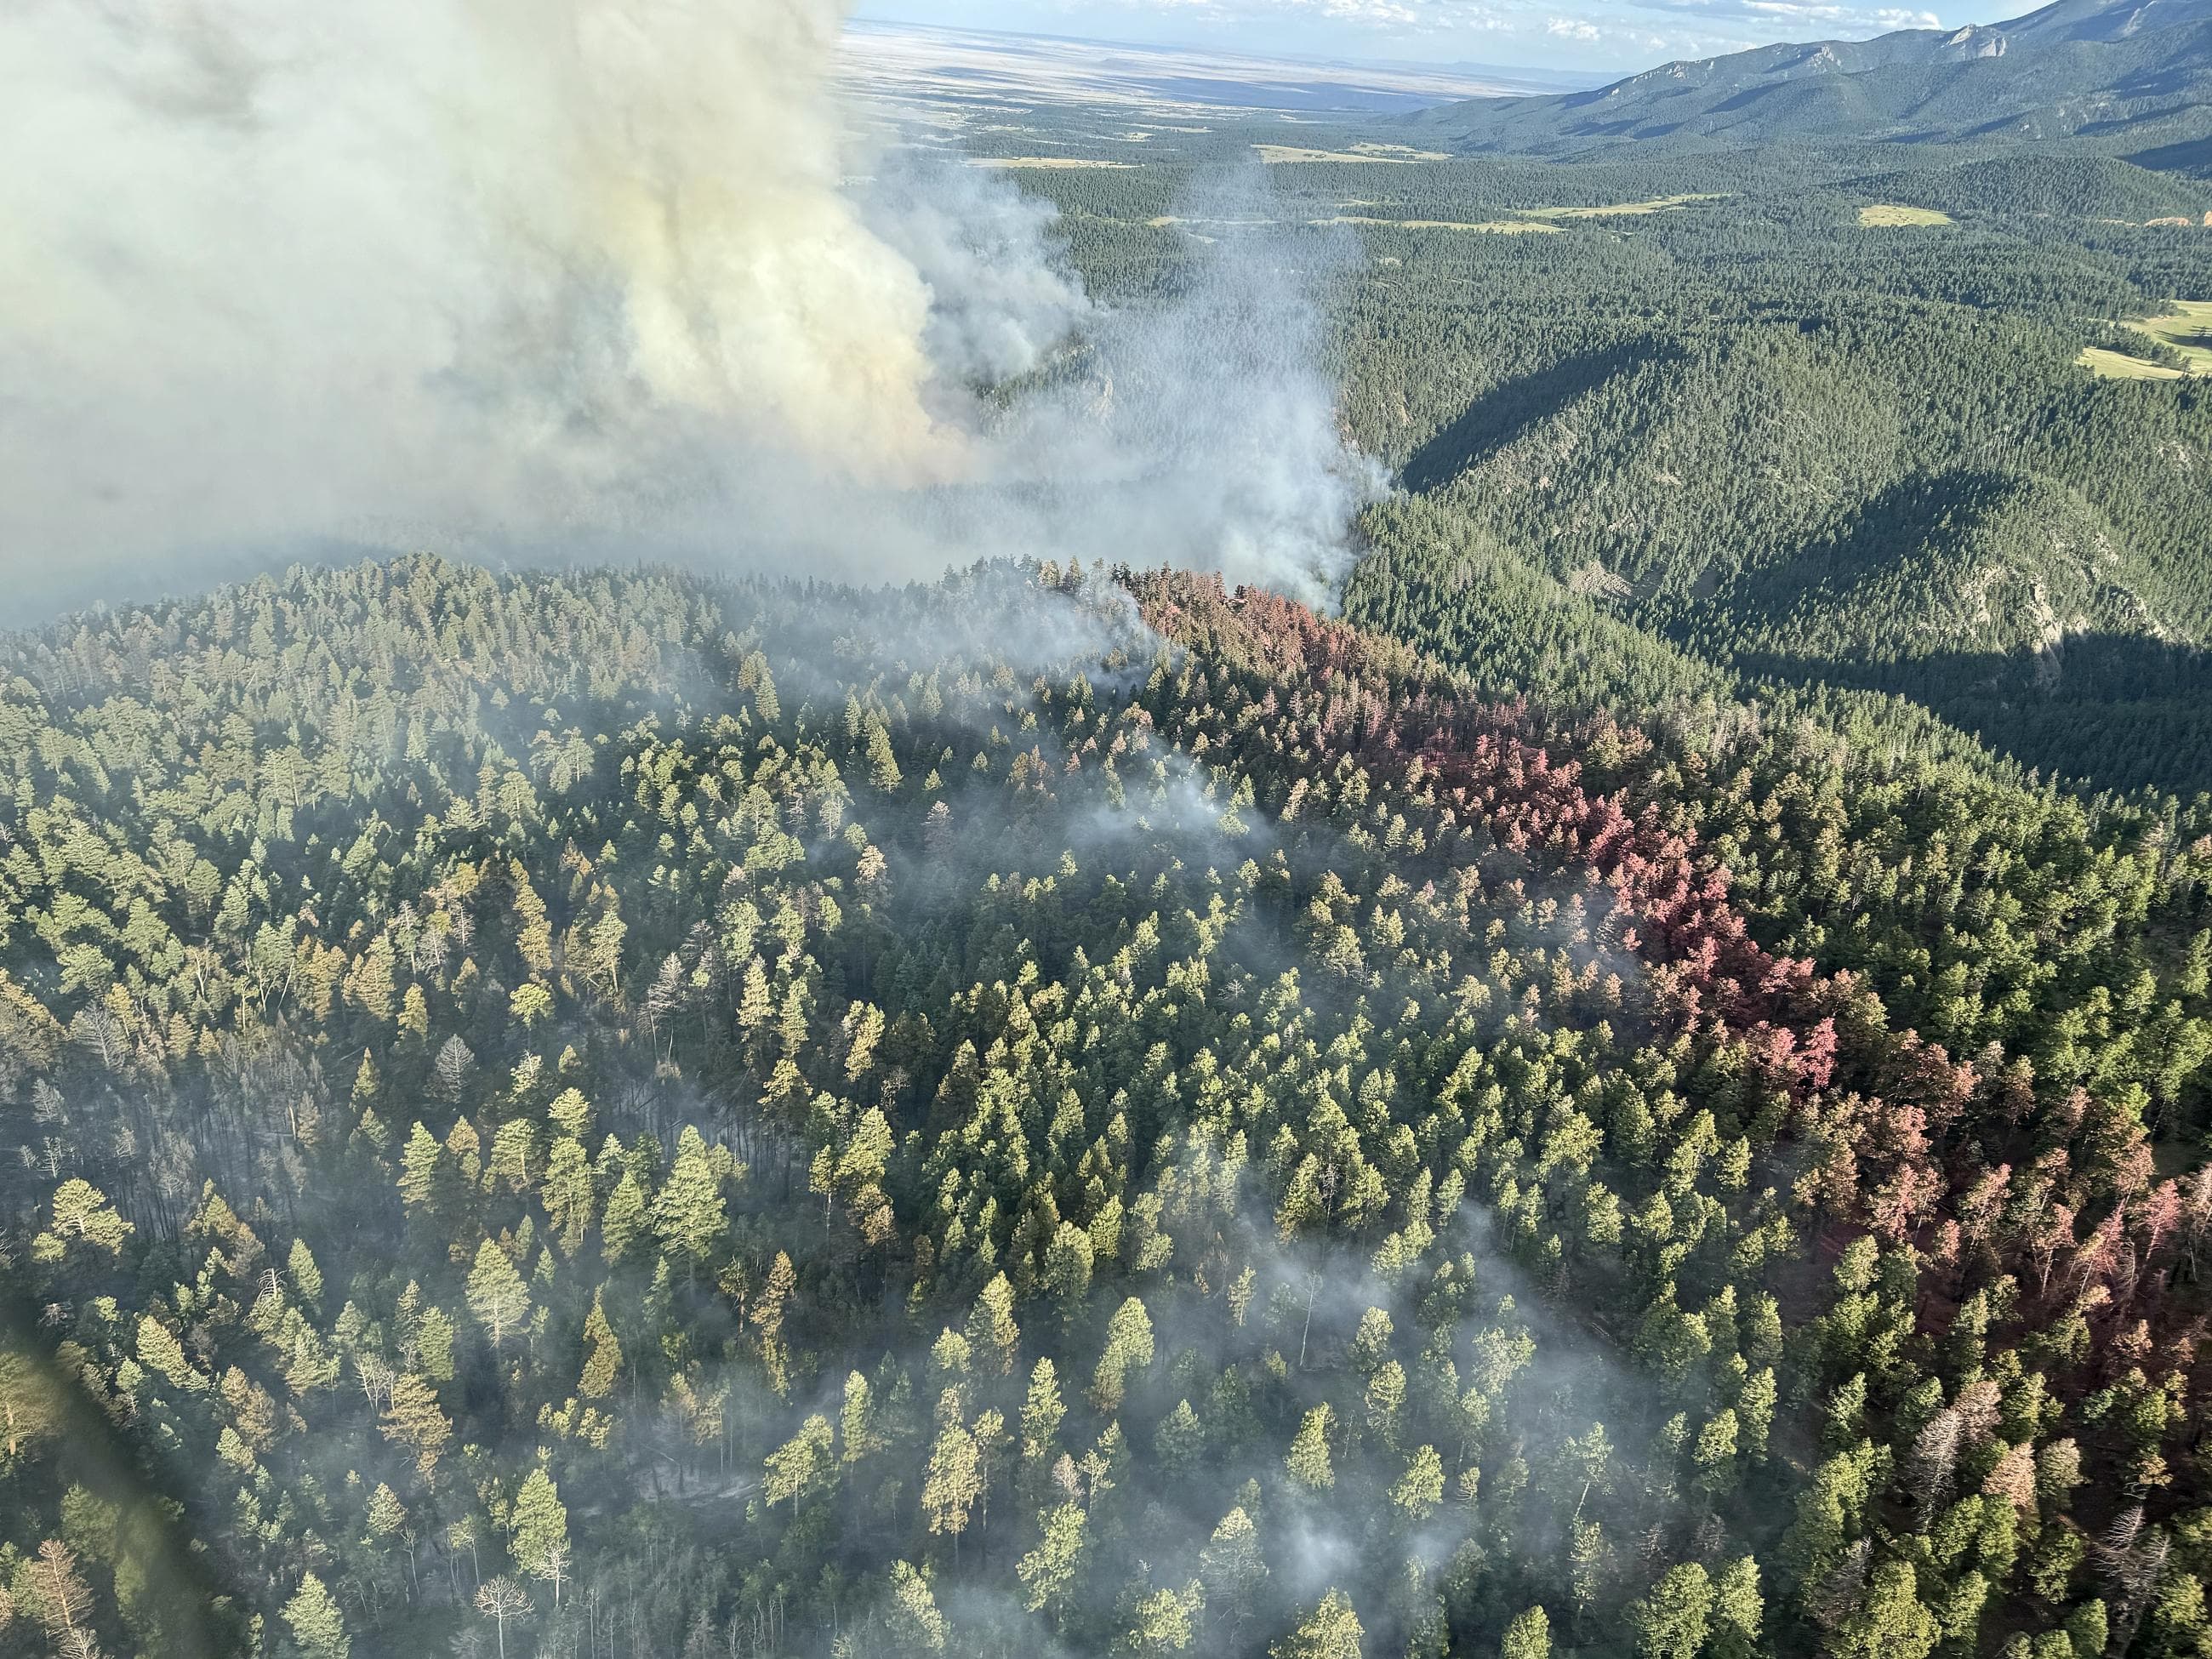
The model runs a probabilistic ensemble: place an ignition, sample a weather stream, grow the fire, and measure the consequence. The results roll up to a score for each segment.
Ignitions are placed at controlled intervals along your infrastructure so every span is tested.
Five inputs feed the model. Dataset names and providers are published in the technical documentation. Forecast weather runs on the US operational models by default. Where a team already has a commercial or in-house feed under contract, such as DTN, Vaisala, or another provider, Flarecast can ingest that instead.
Hover an input to see what it contributes.

Sensitivity in practice
Rather than rating a corridor as one object, the model tests it span by span. Simulated ignitions are placed at controlled intervals along the line. Each one grows into a fire under the conditions of the day, and the structures those fires reach are attributed back to the segments that produced them.
The result reads directly on the map: exposure clusters where consequence concentrates, and the segments driving it are obvious. That is the evidence behind operational calls like Public Safety Power Shutoffs (PSPS).
Ignition spacing is derived for each deployment from corridor length and asset density, then tightened until segment scores stop changing. The interval used for your system is stated in the technical documentation.
Fire growth in Flarecast is simulated by a peer-reviewed spread model with a public operational record. For more details including full citations and validation results, contact us for the technical documentation.
Peer reviewed
updated2026
The spread model and its automated calibration method were published in a peer-reviewed journal and have been refined continuously since, with the latest engine update this year.*1
Operational since 2020
6seasons
Fire seasons of real-time forecasting on most large fires in the continental US, with spread forecasts out to 14 days on the public platform the same engine drives.*2
Graded against real fires
214forecasts
Seven-day spread forecasts from the 2022 season, compared after the fact with what burned; 96% rated acceptable or better. Independent UC Berkeley tests on the 2017 Tubbs and Thomas fires found burned-area overlap above 85%.*3
Timing follows the US operational weather models that drive the forecast by default, all of them run by NOAA, the National Oceanic and Atmospheric Administration, within the US Department of Commerce. A commercial or in-house forecast feed can be ingested in their place, in which case cadence and horizon follow that feed. Ignition spacing is not listed here because it is derived for each deployment from corridor length and asset density.
Dataset providers, model configuration, and validation results are shared with qualified teams during evaluation.